Figures & data
Figure 1. The schematic illustration of the fabrication of SiO2–APS–GO hybrids.
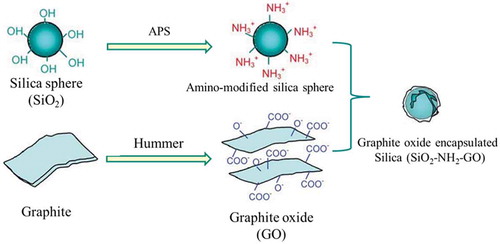
Table 1. The zeta value of SiO2, SiO2–NH2, and GO.
Figure 2. The SEM images of (a) pristine SiO2 (b) GO@SiO2 hybrid; (c)TEM; and (d) HRTEM of GO@SiO2 hybrid.
Table 2. The element analysis of SiO2, SiO2–NH2, GO@SiO2, and GO.
Figure 3. The FT-IR spectra curves of pristine SiO2, SiO2–NH2, GO@SiO2, and GO.
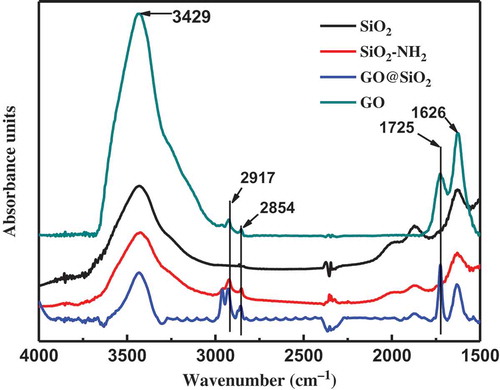
Figure 4. The Raman spectrum of GO and GO@SiO2.
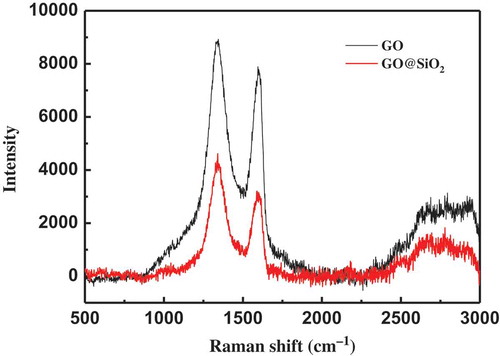
Table 3. The element analysis of GO and in situ thermal reduction of graphene.
Figure 5. The C1s X-ray photoelectron spectroscopy of GO and RGO.
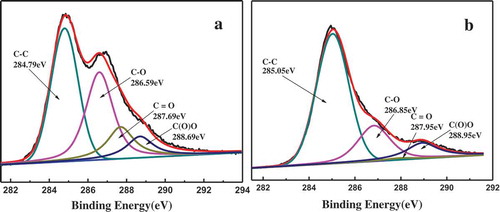
Figure 6. The TGA curves of GO and RGO.
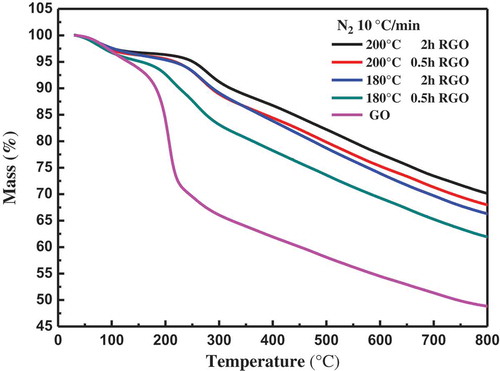
Figure 7. The SEM figures of fracture surfaces of RGO@SiO2/PDMS composites with different filler content (a, b) 30 phr (c, d) 60 phr.
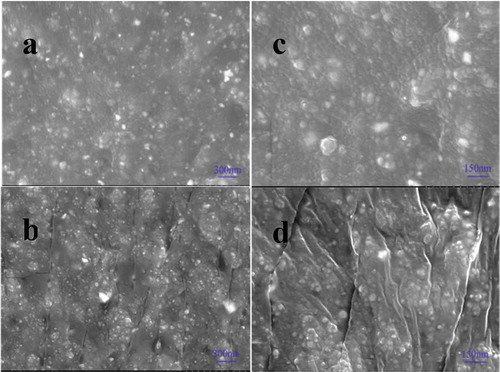
Table 4. The conductivity of RGO@SiO2/PDMS composites.
Table 5. The electromechanical properties of RGO@SiO2/PDMS composites.
Figure 8. Strain–stress curve of PDMS and PDMS with 30 and 60 phr of RGO@SiO2.
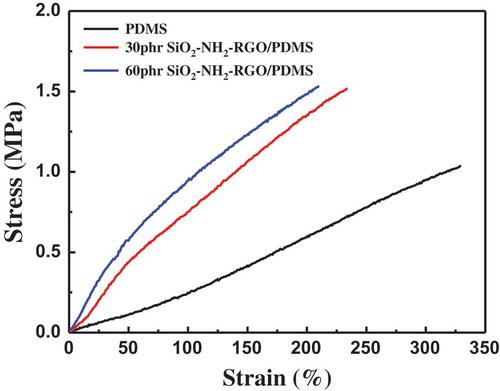
Figure 9. Frequency response of dielectric constant (a) and dielectric loss (b).
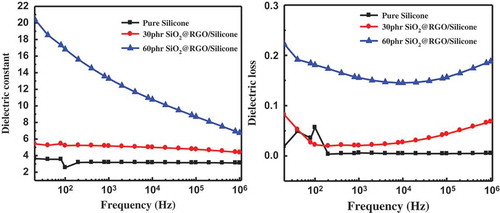
Table 6. Comparison of actuated performances of advanced DE composites.
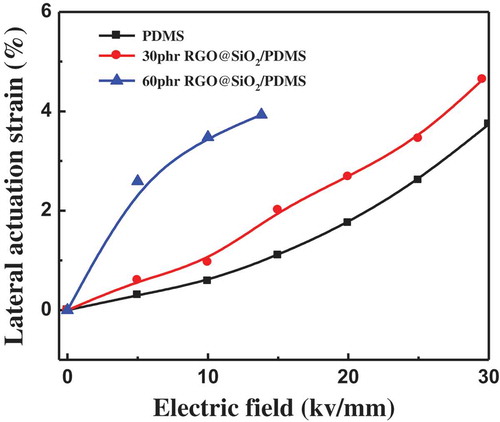
Figure 10. Lateral actuation strain of PDMS and RGO@SiO2/PDMS composites as a function of electric field.