Figures & data
Figure 1. Schematic diagram of the configuration used to measure the dielectric strength of a soft elastomer film backed by a planar rigid electrode and indented by a hemispherical rigid electrode.
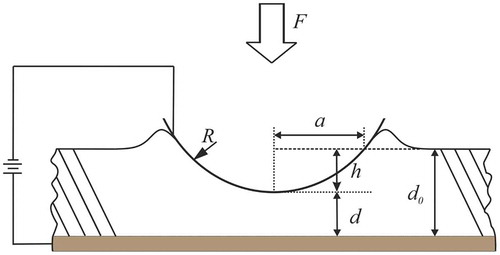
Figure 2. Experimental setup: (a) schematic of the system; (b) visualization of the entire system; (c) magnification of the sample, electrodes, and electrical contacts.
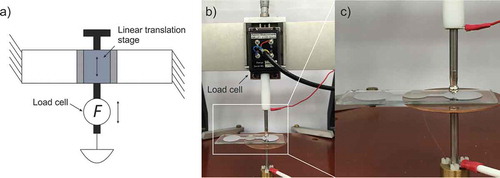
Figure 3. Examples of voltage, current, and force signals simultaneously measured during a breakdown test. It is worth noting the typical stress relaxation of the elastomer that continues for the entire duration of the test, even after the breakdown event. The inset photo shows the damage left on the elastomer by the electrical breakdown, visualized using a confocal microscope.
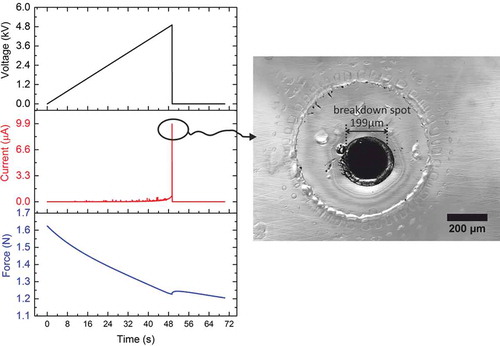
Figure 4. Preparation of the samples: the dielectric elastomer film (I) is first radially pre-strained by 300% using a stretching apparatus (II) and then attached to a glass substrate with an evaporated aluminum electrode (III). An aluminum foil was used to connect the planar electrode to the high-voltage lead and a silver conductive paint was applied to ensure the electrical contact between the aluminum foil and the electrode. Note that in the picture the evaporated Al electrodes (which coat the top surface of the glass substrate) are two in number (so as to test two regions of the same elastomer sample), and they appear black because of an optical effect.
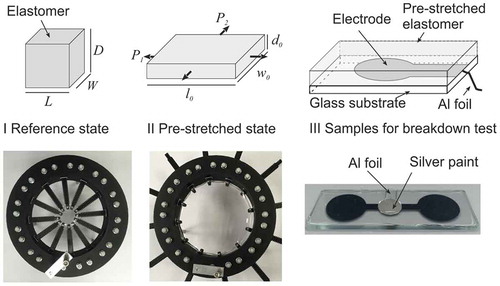
Figure 5. Schematic of the micro-indentation system used to correlate the penetration depth to the applied force.
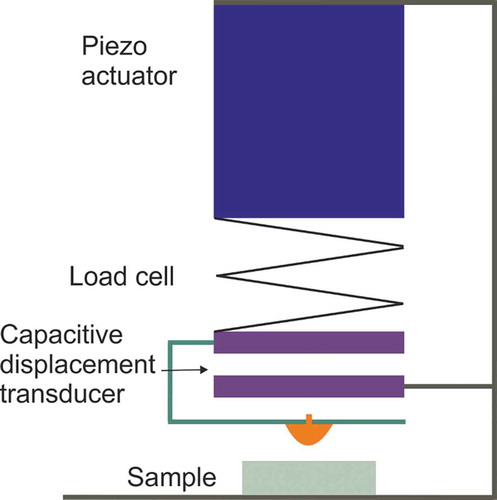
Figure 6. Microscopic images showing a circular mark that was left on the elastomer film by a hemispherical electrode with R = 2.5 mm after an indentation with F = 2 N, as soon as the electrode was pulled out: in (a) the mark is visualized under a conventional bright light microscope; in (b) the same mark is visualized more clearly under a confocal microscope, which enhances the edges; in (c) the mark is identified by a circle via post-processing of the confocal microscopic image. Note: the images show also a large number of air bubbles of variable size (including a very big one on the right-hand top side), which remain trapped between the elastomer film and the underlying glass slide, resulting from the film being stretched and released while the hemispherical electrode is pulled away.
Figure 7. Contact area as a function of the radius of curvature of the hemispherical electrode under an applied force of 2 N: comparison between values calculated from measurements of the penetration depth (Equation (2)) and values calculated from measurements of the base radius (Equation (5)). For the data points related to Equation (5), error bars represent the standard deviation of five measurements. For the data points related to Equation (2), the error was determined with reference to the accuracy (20 nm) of displacement sensing offered by the micro-indentation system; however, the resulting error was too small to be visible in this figure. Lines connecting data points are used as a guide for the eye.
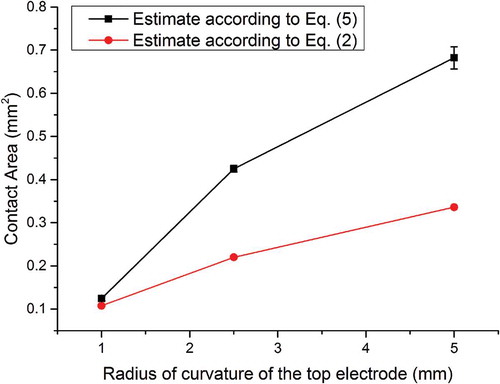
Figure 8. (a) Results of the micro-indentation of the elastomer film with the different hemispherical electrodes used as indenters having a different radius of curvature R: penetration depth h as a function of the applied force F; dots have been added to the curves returned by the measurements to mark the initial values of the force used in the breakdown tests. (b) Material’s stiffening effect due to the indentation: average stress σ as a function of the penetration depth h; lines connecting data points are used as a guide for the eye.
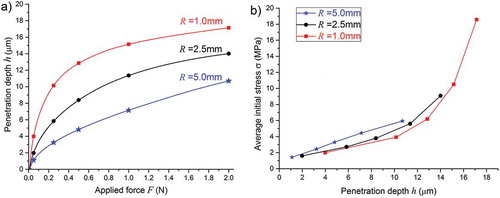
Figure 9. Contact area A (a) and average initial stress σ (b) as functions of the applied force F (initial value used in the breakdown tests), for different radii of curvature R of the hemispherical electrode. Lines connecting data points are used as a guide for the eye.
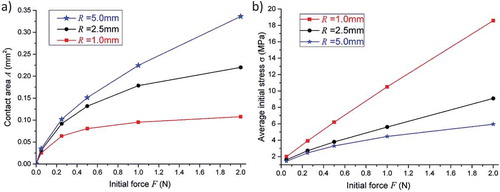
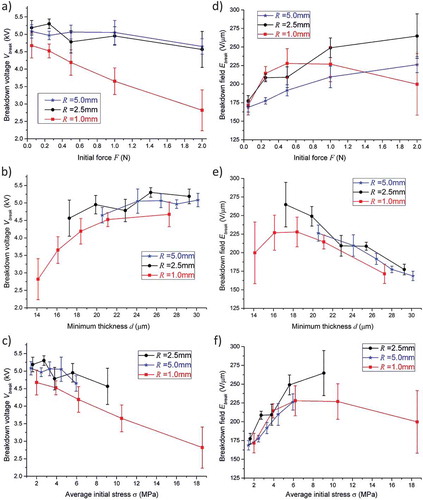
Figure 10. Electrical breakdown variables for the different radii of curvature R of the hemispherical electrode: breakdown voltage (a, b, c) and breakdown field (d, e, f) as functions of the applied force F (initial value), minimum thickness d and average stress σ (initial value) resulting from F. Bars represent the standard deviation of 36 measurements. Lines connecting data points are used as a guide for the eye.