
Figures & data
Figure 1. AFM micrographs of NR/NBR/AO-80 composites with various mass ratios NR/NBR/AO-80: (a) 25/75/30, (b) 50/50/20, and (c) 75/25/10.
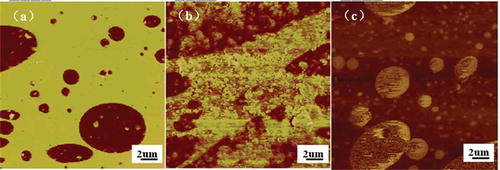
Figure 2. Temperature dependence of loss tangent (tanδ) for NR/NBR/AO-80 composites with various NR/NBR/AO-80 mass ratios.
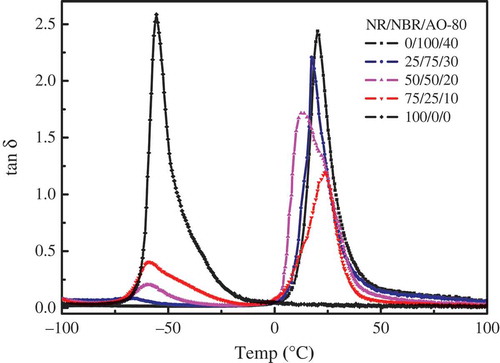
Figure 3. FTIR spectrum of NR/NBR/AO-80 (75/25/10) composite.
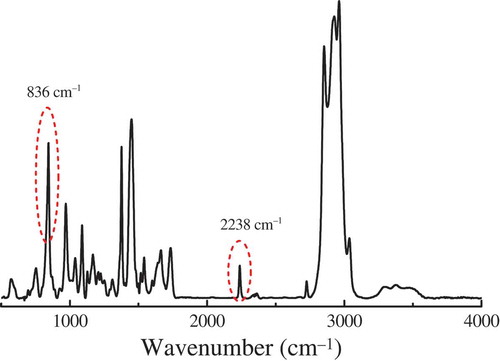
Figure 4. FTIR polarization spectra of NR/NBR/AO-80 (75/25/10) composite under different uniaxial elongations at (a) 836 cm−1 and (b) 2238 cm−1.
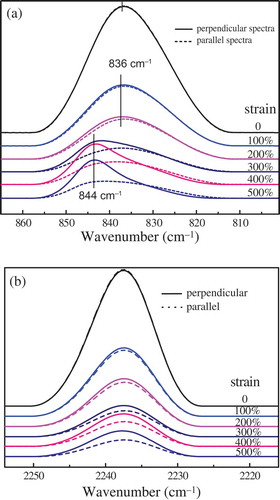
Figure 5. Strain dependence of DF for absorption bands at 836 and 2238 cm−1 of FTIR spectrum of NR/NBR/AO-80 (75/25/10) composite.
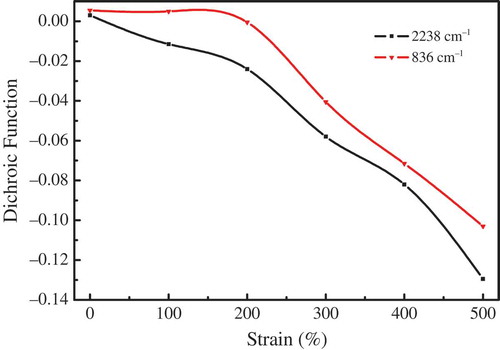
Figure 6. Stress–strain curves of NR/NBR/AO-80 composites with different mass ratios of NR/NBR/AO-80.
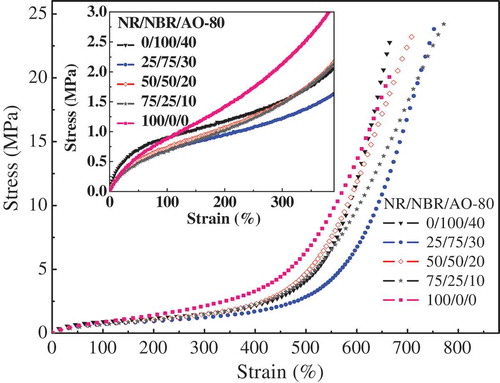
Figure 7. Schematic diagram of hysteresis loop of rubber composite.
Table 1. Relationship between HED and strain of NR/NBR/AO-80 composites.
Table 2. Damping properties of NR/NBR/AO-80 composites with various mass ratios of NR/NBR/AO-80.