Figures & data
Figure 1. Geometry of FG nanoplate under magneto-electrical field.
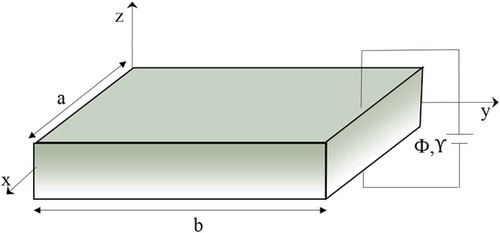
Table 1. Magneto-electro-thermo-elastic coefficients of material properties (Ramirez et al. [Citation3]).
Table 2. Comparison of dimensionless buckling load () of simply supported square FG nanoplates (a/h = 10).
Table 3. Variation of critical buckling temperature of FG nanoplate for various electric voltages and nonlocal parameters (a = b = 100 h, p = 1).
Table 4. Variation of critical buckling temperature of FG nanoplate for various magnetic potentials and nonlocal parameters (a = b = 100 h, p = 1).
Figure 2. Variation of critical buckling temperature of METE-FG nanoplate versus gradient index for various electric voltages and thermal loadings (a/h = 100, µ = 1 nm2, Ω = 0*10-4).
Figure 3. Variation of critical buckling temperature of METE-FG nanoplate versus gradient index for various magnetic potentials and thermal loadings (a/h = 100, µ = 1 nm2, V = 0*10-4).
Figure 4. Variation of critical buckling temperature of METE-FG nanoplate versus electric voltage for various nonlocal parameters and thermal loadings (a/h = 100, p = 1, Ω = 0*10-4).
Figure 5. Variation of critical buckling temperature of METE-FG nanoplate versus magnetic potential for various nonlocal parameters and thermal loadings (a/h = 100, p = 1, V = 0*10-4).
Figure 6. Variation of critical buckling temperature of METE-FG nanoplate versus aspect ratio for various nonlocal parameters and thermal loadings (a/h = 100, p = 1, V = Ω = 0*10-4).
Figure 7. Variation of critical buckling temperature of MEE-FG nanoplate versus side-to-thickness ratio for various thermal loadings (a/b = 1, p = 1, µ = 2 nm2, V = Ω = 0*10-4).