Figures & data
Figure 1. (a) Structure of the NBD-AE-co-PNIPAAm polymer (m = 157, n = 1). (b) Infrared absorption spectrum of the NBD-AE-co-PNIPAAm polymer.
Figure 2. Schematic of the process for preparing the thermosensitive particle tracers.
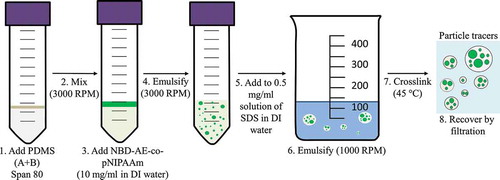
Figure 3. (a) Schematic of the experimental apparatus for the PIV experiment. (b) Image recorded during the PIV experiment. The portion of the image used to determine the velocity vectors is indicated by the red contour (region of interest, ROI). The ROI image is displayed after subtraction of the background image. (c) Normalized velocity in the experimental tank at a depth of 0.625 H without the cylinder: solid black, dashed black, and dashed-dotted black lines are the v component of the velocity at 20, 40, and 60 mm downstream of the cylinder, respectively. The solid red line is the average of the velocities in the three sections.
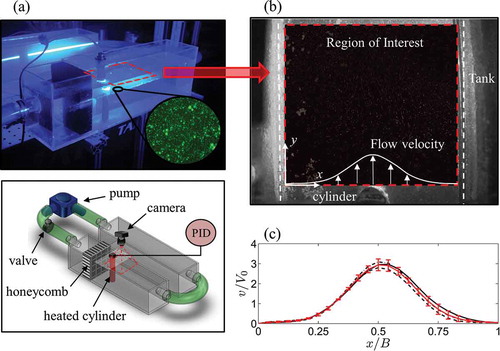
Figure 4. (a) Fluorescence emission of the NBD-AE-co-PNIPAAm polymer as a function of the water temperature. Solid line, dashed-dotted, and dotted lines are emission intensities of the polymer at 28, 31, and 35 °C, respectively. Images displayed in the graphs are obtained by using the optical microscope with a green bandpass filter centered at 530 nm and a blue light excitation source centered at 470 nm. (b) Fluorescence emission of the particles as a function of the water temperature. Solid line, dashed-dotted, and dotted lines are particles’ emission intensities at 28, 31 and 35 °C, respectively. Images of the particles in a glass vial are recorded using the same optical apparatus, which is used in the PIV experiments.
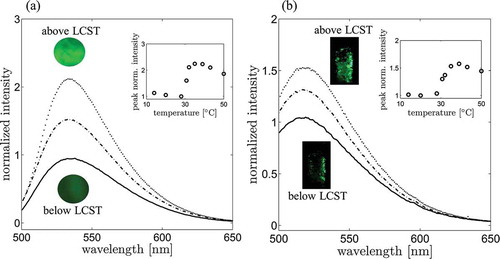
Figure 5. (a) Optical micrograph of the fluorescent particle tracers. (b) Scanning electron micrograph of the particles. (c) Particle diameter distribution obtained from SEM images.
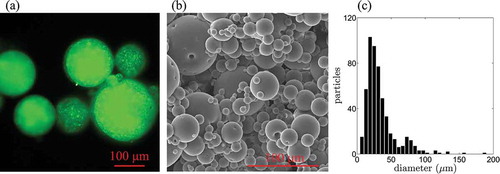
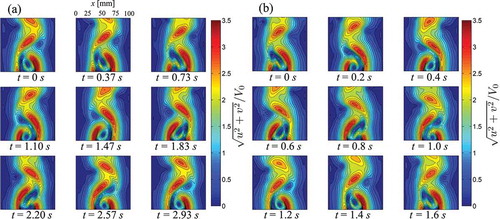
Figure 6. (a) Flow velocities measured during the PIV experiment at nine successive time instants t over one shedding period for V0 = 15.3 mm/s. (b) Flow velocities measured during the PIV experiment at nine successive time instants t over one shedding period for V0 = 30.7 mm/s.
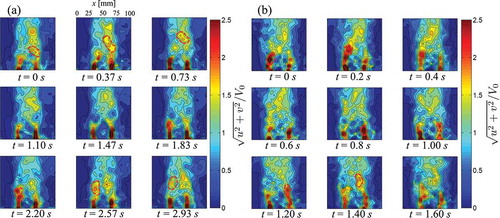
Figure 7. (a) Average flow velocity over one period at y/B = D/B for V0 = 15.3 mm/s. (b) Average flow velocity over one period at y/B = D/B for V0 = 30.7 mm/s. (c) Average flow velocity over one period at x/B = 0.5 – D/B for V0 = 15.3 mm/s. (d) Average flow velocity over one period at x/B = 0.5 – D/B for V0 = 30.7 mm/s. Solid lines are experimental PIV velocities and dashed-dotted lines are numerical results obtained using the computer simulation described in the Appendix.
Figure 8. (a) Number of interrogation regions (10 × 10 pixels) is reported as a function of the number of particles per second detected in each region for V0 = 15.3 mm/s, corrected by the factor κ = 2.44. (b) Number of interrogation regions (10 × 10 pixels) is reported as a function of the number of particles per second detected in each region for V0 = 30.7 mm/s, corrected by the factor κ = 1.92. Red is the particle count when the cylinder is at 60°C, and black refers to the experiment in which the cylinder is kept at room temperature. In the insets, spatial distribution of the corrected particles/second value in the ROI, obtained by subtracting the particle distribution measured at room temperature from the particle distribution measured at 60 °C. White lines are contour lines of the time averaged velocity field (8 seconds) estimated using PIV data. The position of the cylinder and the flow direction are indicated below the insets.
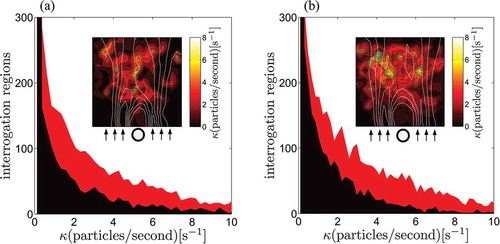
Figure A1. (a) Flow velocities at nine successive time instants t over a time period for V0 = 15.3 mm/s. (b) Flow velocities at nine successive time instants t over a time period for V0 = 30.7 mm/s.