Figures & data
Figure 1. Schematics of the simulation process.
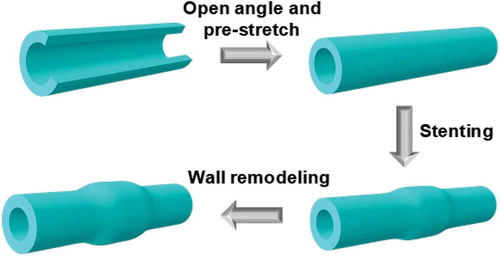
Figure 2. Computational model framework that couples the residual stress with hyperelastic stressed-based growth model.
Figure 3. Multiplicative decomposition of the deformation gradient in the growth model: intermediate configuration with growth and elastic components.
Table 1. Cases and steps used for the simulation setup.
Figure 4. Geometry of the coronary artery model, the stent is placed in the middle of the model.
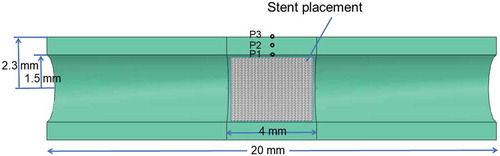
Table 2. Inner and outer radii used at the stress-free states for the 3 cases.
Figure 5. Contours of components of Cauchy stress (Pa) and von Mises stress (Pa) before the stenting begins for Case 2.
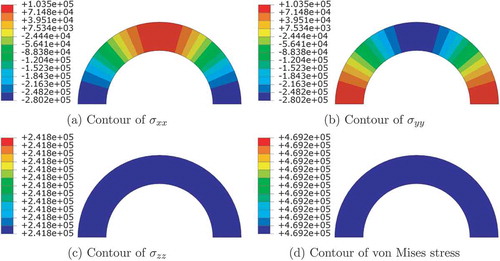
Figure 6. Von Mises stress (Pa) distribution at different stages.
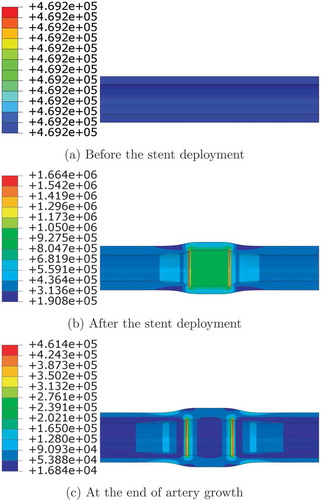
Figure 7. Evolution of von Mises stress at the inner wall (P1), middle wall (P2), and outer wall (P3) .
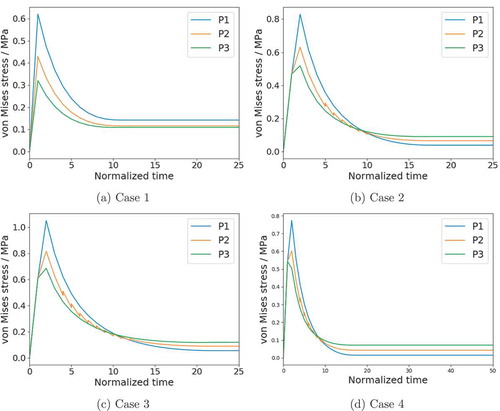
Figure 8. Evolution of growth factor during growth at the inner wall (P1), middle wall (P2), and outer wall (P3) .
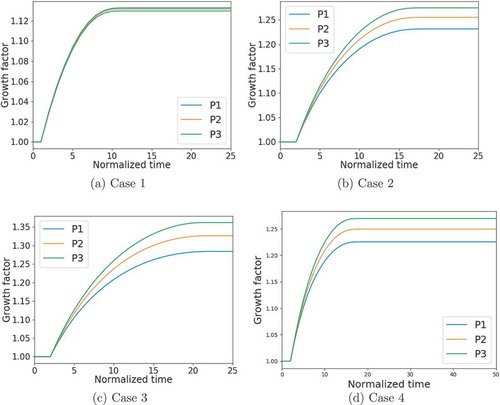
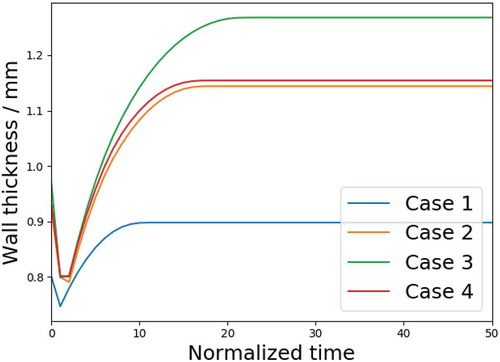
Figure 9. Wall thickness during stent deployment and in-stent restenosis.