Figures & data
Figure 1. A 3D schematic model of piezoelectric-based cantilever energy harvester with non-uniform width and height.
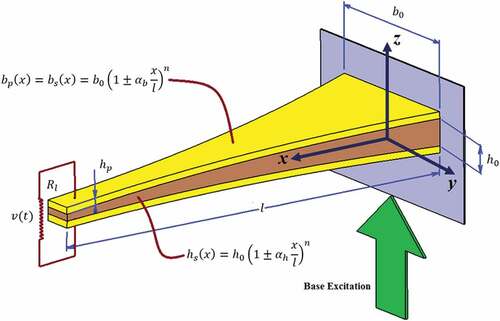
Figure 2. Two-node finite element with four DOF.
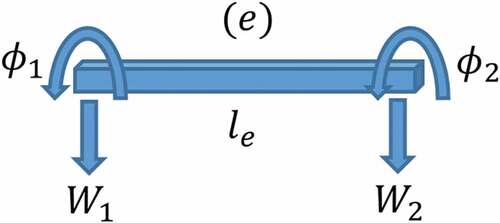
Table 1. Properties of the uniform bimorph piezoelectric cantilever beam.
Table 2. Fundamental resonance frequency of piezoelectric energy harvester without tip mass.
Table 3. Fundamental resonance frequency of piezoelectric energy harvester with tip mass (0.239 g).
Figure 3. A 3D simulated structure of an array of diverging bimorph PEHs.
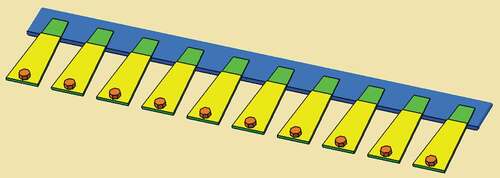
Table 4. Properties of the tapered bimorph piezoelectric cantilever beam.
Table 5. Validation of piezoelectric energy harvester’s voltage for different tapering values.
Figure 4. Power output variation versus polynomial degree under different tapering ratios in width direction ().
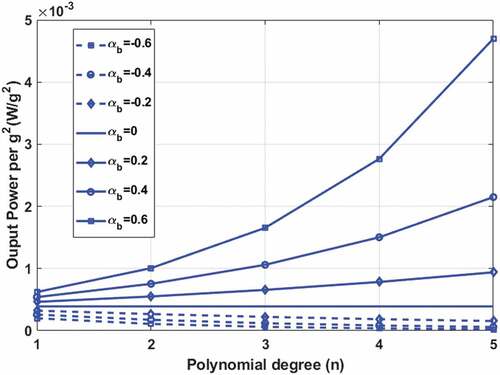
Figure 5. Power output variation versus polynomial degree under different tapering ratios in height direction ().
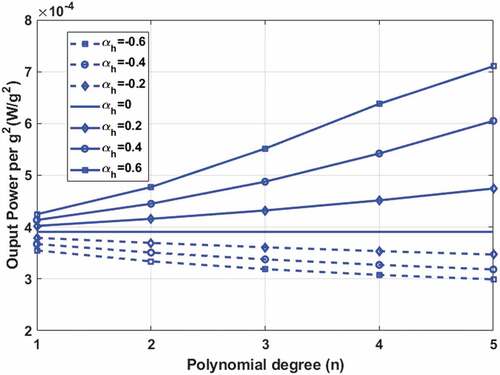
Figure 6. Efficiency variation versus polynomial degree under different tapering ratios in width direction ().
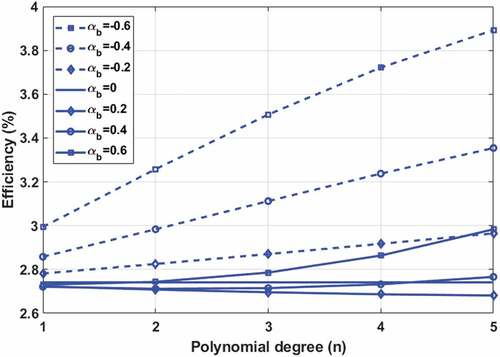
Figure 7. Efficiency variation versus polynomial degree under different tapering ratios in height direction ().
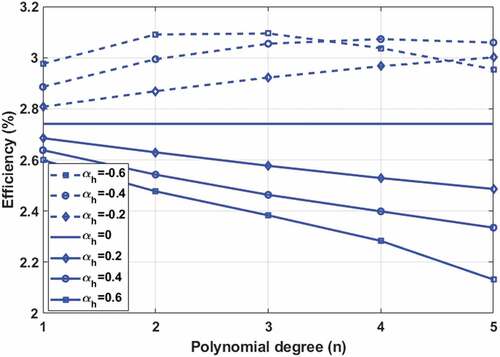
Figure 8. A power FRF curves for quintic tapered beam in width direction.
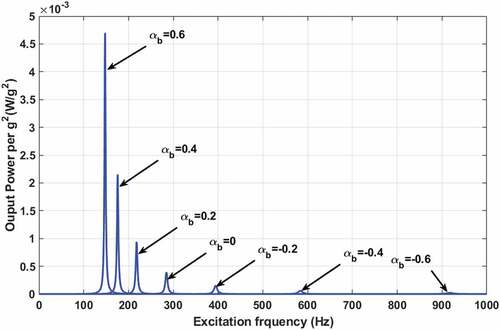
Figure 9. A power FRF curves for quintic tapered beam in height direction.
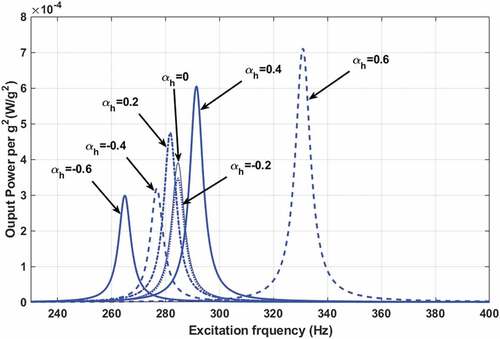
Figure 10. A power FRF curves for tapered beam () of different polynomial degrees.
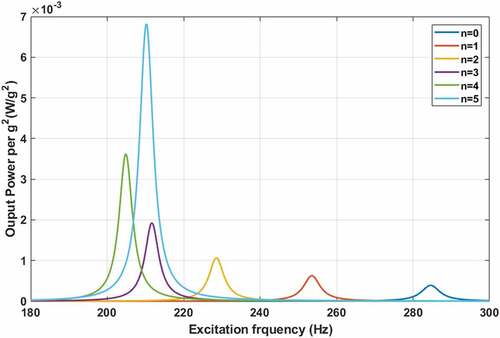
Figure 11. Comparison of power FRFs between one uniform beam and an array of multiple uniform beams.
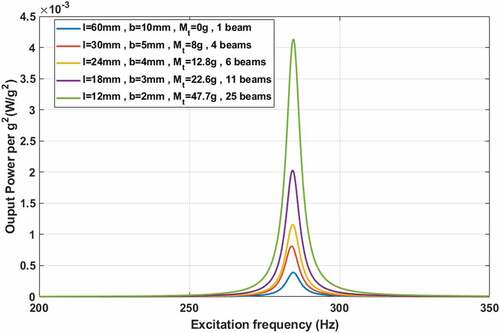
Figure 12. Comparison of power FRFs per piezoelectric mass between different beam sizes.
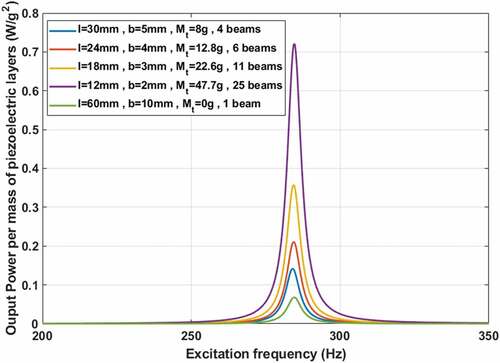
Figure 13. Fundamental frequency as a function of piezoelectric/substrate layer thickness ().
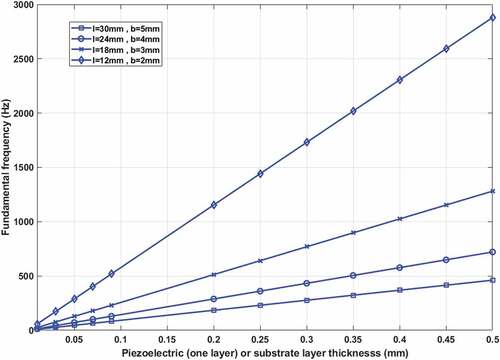
Figure 14. Comparison of power FRFs per piezoelectric mass between different beam sizes.
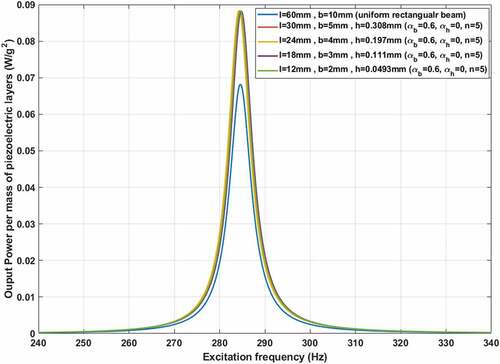
Figure 15. Comparison of maximum power output per piezoelectric mass between different beam ratios.
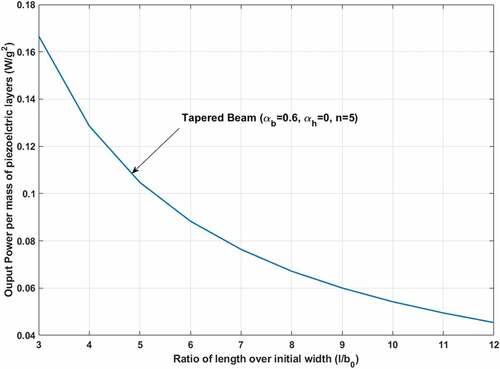
Figure 16. Comparison of power FRFs per piezoelectric mass between different length/width ratios.
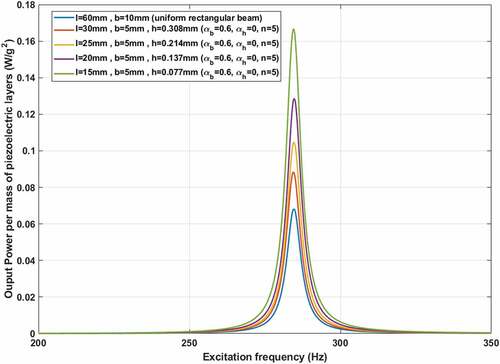
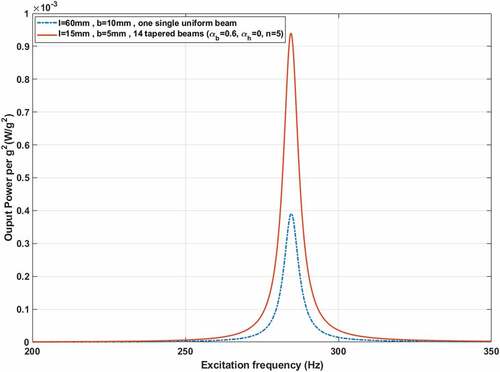
Figure 17. Comparison of power FRFs between the primary uniform beam and an array of tapered beams.