Figures & data
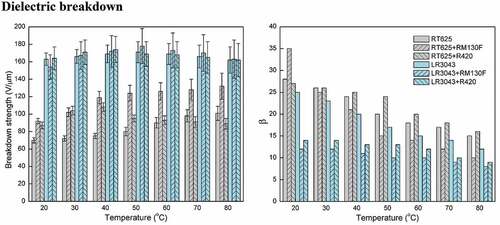
Table 1. Mass ratios of the components in film mixtures*.
Figure 1. Illustration of an electrical breakdown setup. The experimental temperatures are adjusted using a hot air gun, and measured with a thermometer in the air’s atmosphere.
Figure 2. SEM images of the RT625 and LR3043 films, without and with 30phr TiO2 particles.
Figure 3. Relative permittivity and electric loss tangent of the RT625 and LR3043 films, without and with 30phr TiO2 particles, as a function of investigated frequency at 20°C.
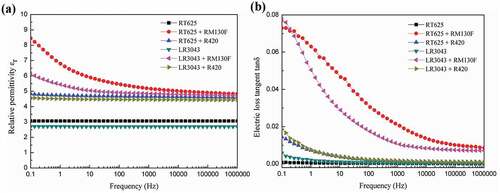
Figure 4. Relative permittivity (ɛr@1 Hz) and storage modulus (G’@1 Hz) of the RT625 and LR3043 films, without and with 30phr TiO2 particles, as a function of the investigated temperature.
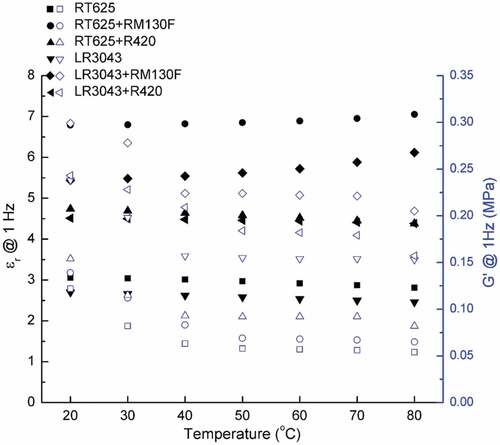
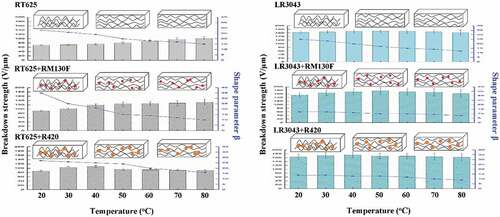
Figure 5. Electrical breakdown strengths of the RT625 and LR3043 films, without and with 30phr TiO2 particles, as a function of the investigated temperature. Associated uncertainties in the experiments are shown in the corresponding error bars.
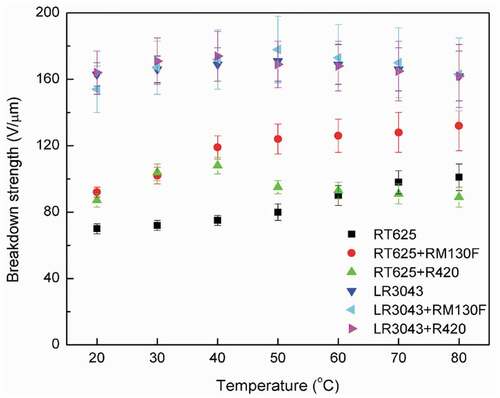
Figure 6. Illustration of the breakdown mechanism, which changes due to the addition of TiO2 particles into silicone films (indicated by blue-waved lines). White arrows indicate the traverse direction of free electrons (green dots) between the electrodes. Yellow arrows indicate how the TiO2 particles (orange dots) capture the charges, thereby enhancing breakdown strength. Green arrows indicate the liberated charges, which traverse through the voids among the particles, eventually leading to reduced breakdown strength.
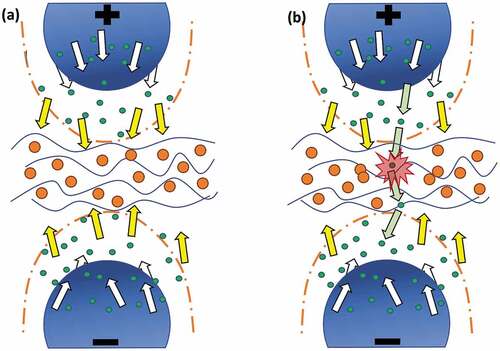
Figure 7. Shape parameter β of the RT625 and LR3043 films, without and with 30phr TiO2 particles, as a function of the investigated temperature.
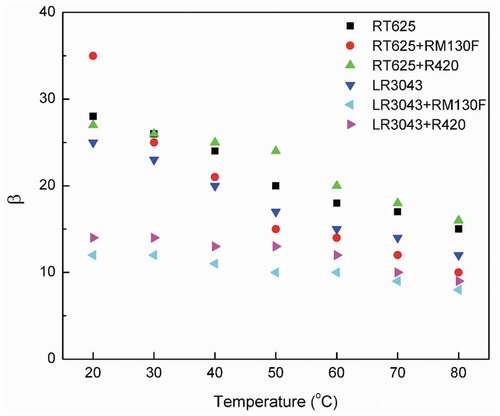
Figure 8. Probability density function (pdf) and cumulative density function (cdf) of the RT625 and LR3043 films, without and with 30phr TiO2 particles, as a function of the investigated temperature.
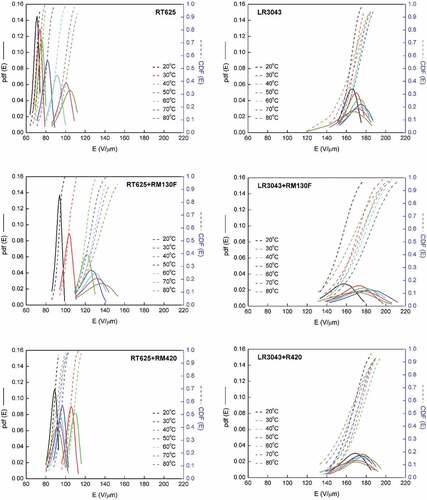
Figure 9. Schematic representation of partial discharges in an air bubble and a charged particle as a polar molecule: Q+ is a positive charge, Q- is a negative charge, Q is total charge, µc is the dipole moment, 2 r is dipole length, and E0 is the electrical field.
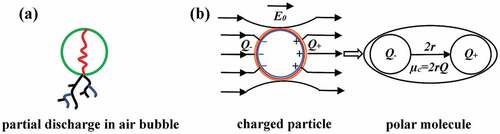
Figure 10. Illustration of the influence of network structure on the breakdown strength and shape parameter of the RT625 and LR3043 films, without and with 30phr TiO2 particles, at the investigated temperature. Red dots indicate the small RM130 F TiO2, and the orange dots indicate the large R420 TiO2, respectively. Black-waved lines indicate silicone networks.