Figures & data
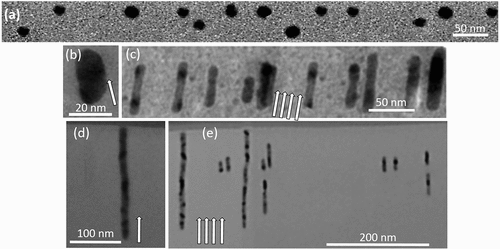
Figure 1. (a) (Color online) 3D Atomic force microscopy (AFM) image of Fe nanoparticles prepared by gas flow sputtering on a Si-SiO2 surface. The nanoparticles size is deduced from the height profile and found to amount to 20 nm diameter (±3 nm). (b) X-ray diffraction patterns of Fe nanoparticles prepared under sputtering pressure of 150 Pa, nanoparticle aggregation length of 200 mm, discharge power of 290 W, and Ar flow rate of about 490 SCCM. The XRD reveals that only α-Fe with bcc structure was detected. The transverse dimension of NPs appears artificially broadened due to the tip size convolution, which is typical characteristics of the AFM measurements.
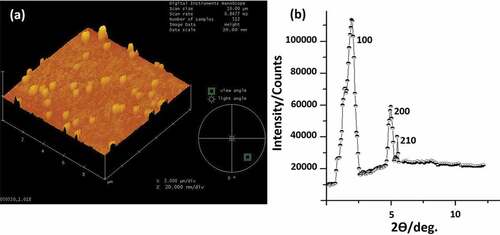
Figure 2. RBS spectrum of a SiO2-Fe NPs layer structure. The oxygen channel, the Si/SiO2 interface and Si edge are indicated. The distinct peak belongs to Fe NPs in the SiO2 layer. The surface channel of the Fe is indicated.
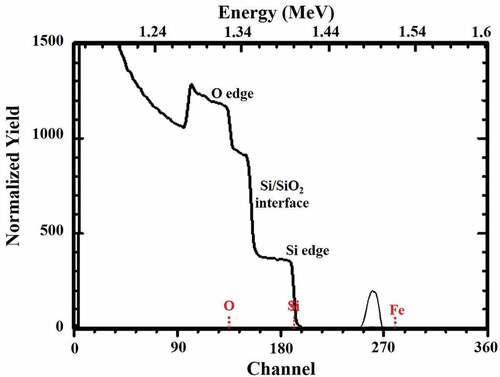
Figure 3. (Color online) Normalized RBS spectra of the 20 nm Fe nanoparticles under 50 MeV Ag ions for two samples prepared with an average nanoparticle density of 0.65 × 10⁹ and 1.5 × 10¹⁰ particles/cm2, (a) and (b), respectively. The slight difference within the normalized yield of the Fe peaks under irradiations with 4 × 10¹⁴ and 8 × 10¹⁴ ions.cm−2 in Figure 3(a) is due to the 10% difference within the as-prepared NPs density. The insets in both Figures represent the corresponding NP shape before and after irradiation. The surface channel of Fe is indicated for each sample. The slight difference in energy-channel conversion is attributed to the different experimental conditions than in plots. The Fe peak shift toward higher energy under irradiation with fluence of 1–3 × 10¹⁴ ions.cm−2 due to NP elongation toward the surface.
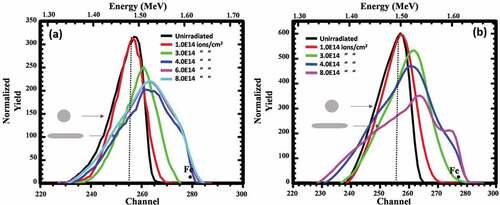
Figure 4. The relative change of the Fe RBS peak (in keV) as a function of the irradiation fluence for the two samples as in . The black line and black circles represent the broadening of the Fe nanoparticles within the lower density sample; 0.65 × 10⁹ particles/cm2. The red line and red squares represent the broadening of the Fe nanoparticles within the higher density sample; 1.5 × 10¹⁰ particles/cm2.
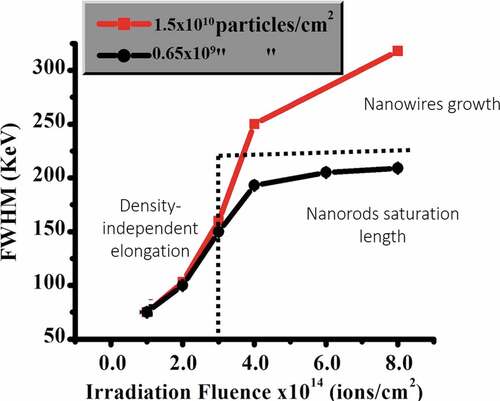
Figure 5. X-TEM images of: Fe nanoparticles before irradiation (a), single NP under irradiation with 50 MeV Ag ions to a fluence of 3 × 10¹⁴ ions.cm−2 (b), Fe NPs with the lower density under irradiation to a fluence of 8 × 10¹⁴ ions.cm−2 (c), Fe NPs with the higher density under irradiation with fluence of 8 × 10¹⁴ ions.cm−2 (d) and (e), respectively.

Figure 6. TEM micrographs for two large Fe NPs (presumably with 50 nm diameters) under irradiation with 50 MeV Ag ions to the maximum fluence of 8 × 10¹⁴ ions.cm−2, (a) and (b), respectively. The white dot circles represent the original nanoparticle size. The direction of the ion beam is indicated by the white arrows for the particles.
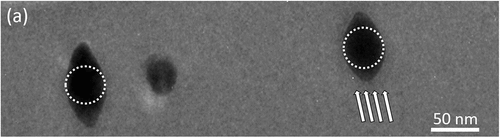
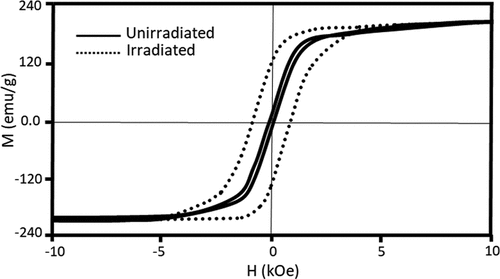
Figure 7. The saturation magnetization Ms and coercivity Hc curve measured at 2 K for pristine NPs (solid line) and irradiated NPs with 50 MeV Ag ions to a fluence of 4 × 10¹⁴ ions.cm−2 (dot line), respectively. A maximum magnetic field of 20 kOe is applied parallel to the ion beam direction.