Figures & data
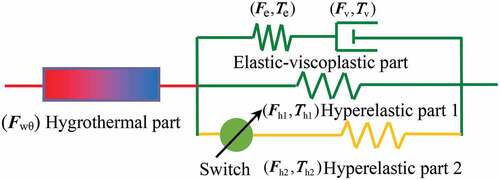
Figure 1. A rheological analog illustration for the constitutive relations
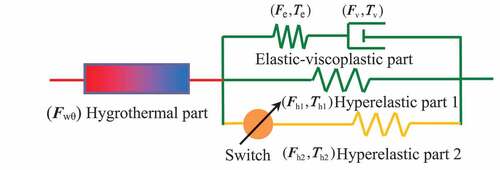
Figure 2. Parameter fitting for the effect of filler on the glass transition temperature
Figure 3. Parameter fitting for the moisture diffusion of CB0. The test data are plotted as geometrical shapes, while the model results are shown as solid lines
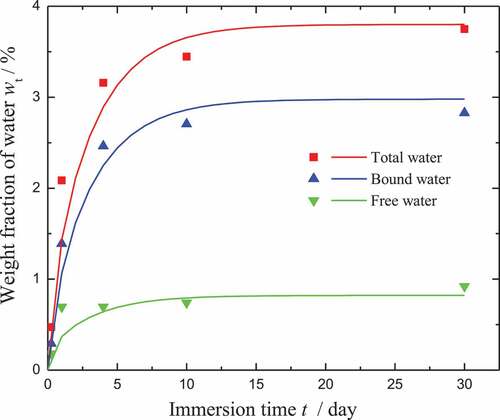
Figure 4. Parameter fitting for the effect of moisture on the glass transition temperature of CB0
Figure 5. Parameter fitting and phase decomposition for the moisture diffusion of (a) CB4, (b) CB7, (c) CB10, (d) CB13, and (e) CB15
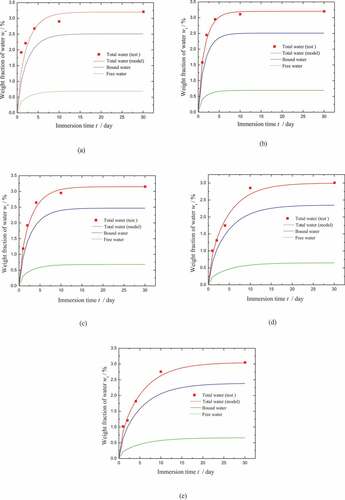
Figure 6. Parameter fitting for the effect of moisture on the glass transition temperature of (a) CB4, (b) CB7, (c) CB10, (d) CB13, and (e) CB15
Figure 7. Parameter fitting for the young’s modulus of the carbon powder
Figure 8. Comparison of the model results and test data for the stress-strain response of the first 3 steps for (a) CB0 and (b) CB4
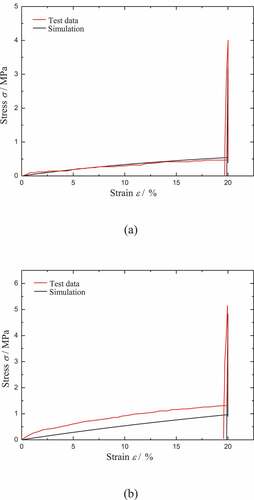
Table 1. Parameters of the model
Figure 9. Comparison of the model results with the test data for the free recovery of (a) CB0 and (b) CB4 during heating
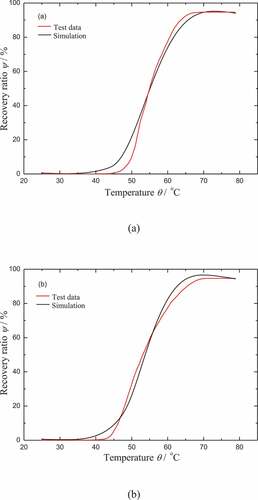
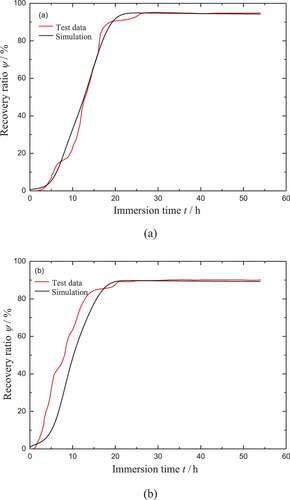
Figure 10. Comparison of the model results with the test data for the free recovery of (a) CB0 and (b) CB4 during moisture absorption