Figures & data
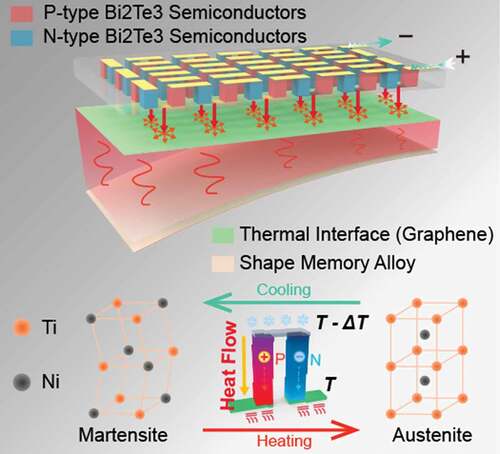
Figure 1. a) A schematic diagram of the f-TES composite. b) The principle of the Peltier effect. c) An f-TES composite that is bent by hand. The bending radius is ~23 mm. d) Clamping conditions and characteristic deformation states. e) Steps in the f-TED construction.
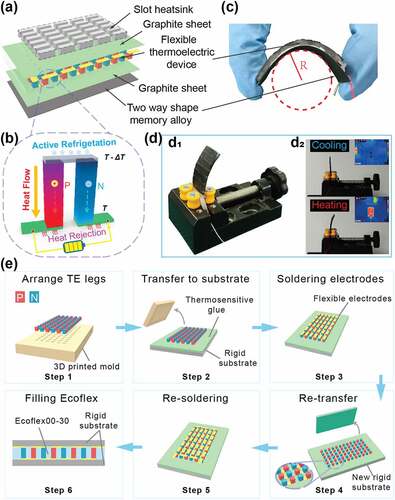
Figure 2. DSC measurement results of the SMA sheet.
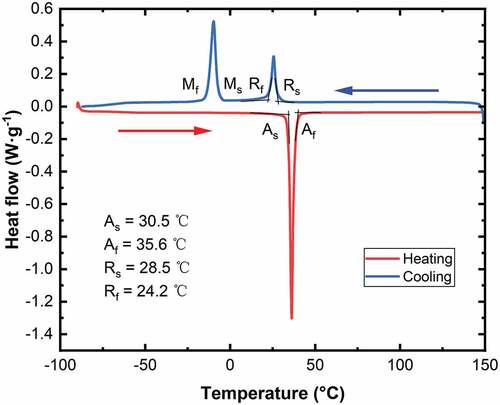
Figure 3. a) Heat transfer sketch of the f-TES composite in the heating mode. b) The rise in SMA temperature at different currents. c-f) Pictures and thermal images of the heating Bend of the f-TES composite (from a front- and side-view).
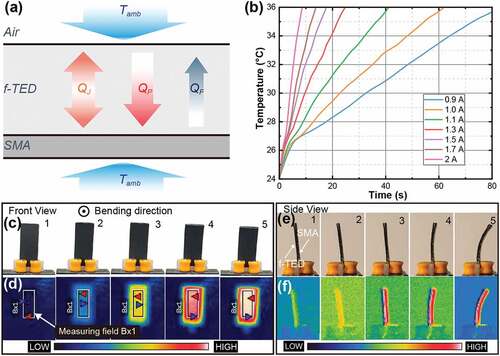
Figure 4. a-d) Pictures and thermal images of the f-TES composite in the cooling mode (from a front- and a side-view). e) Heat dissipation curves for the SMA at different currents. f) Cooling time versus current.
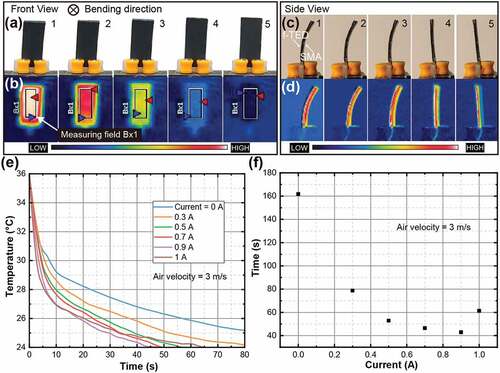
Figure 5. Factors improving the cooling performances of the f-TES composite. a) Tests in operation currents after adding a heat sink. b) Tests at different air velocities for a 1 A operating current.
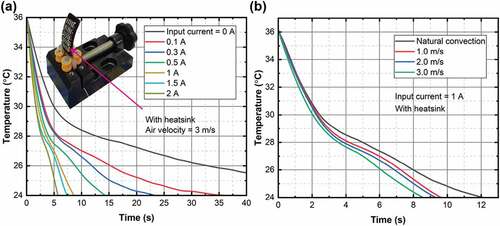
Figure 6. Kinetic testing of the f-TES composite. a) Definition of the bending angle, which is formed between the line connecting the free end (target point) and the fixed end (origin), and the vertical reference line. b) Time evolution of the bending angle and angular velocity. The angular velocity over the complete time span can be separated into 4 stages. M1: forward deformation stage, S1: end of bending deformation stage, M2: reverse deformation stage, and S2: end of reverse deformation stage. c) Evolution of the volume fraction of the temperature-induced R-phase. d) Blocking force test.
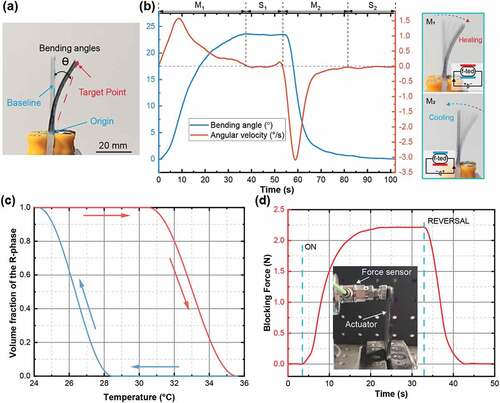
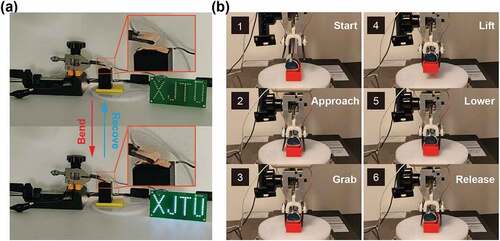
Figure 7. Two examples of applications for the f-TES composite. a) Switch to control the LED. b) Gripper to catch and release objects.