Figures & data
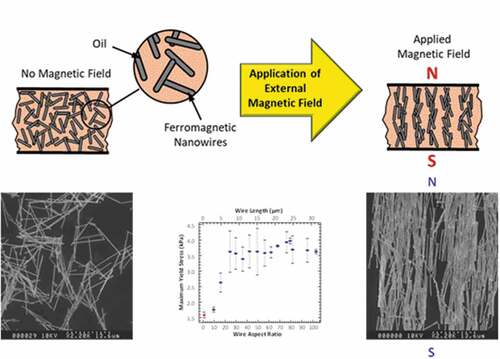
Figure 1. SEM micrograph of quasi-spherical cobalt particles with nominal 1.6 μm diameters as reported by the manufacturer.
Figure 2. SEM micrograph of 10.98 ± 1.98 μm long cobalt nanowires with 305 ± 66 nm diameter.
Table 1. Average length and size distribution of the cobalt nanowires in which n number of wires were evaluated of each type. All wires had an average diameter of 305 ± 66 nm.
Figure 3. XRD of cobalt wires in which the lattice planes are indicated in () brackets. The spectra indicates that the cobalt crystal structure is hexagonal close packed with no peaks present for an oxide layer.
Figure 4. Hysteresis loops of cobalt nanowires within the alumina template measured at 298 K. The dotted line was measured with the applied field parallel to the long axis of the nanowires. The solid line was measured with the applied field perpendicular to the long axis of the nanowires.
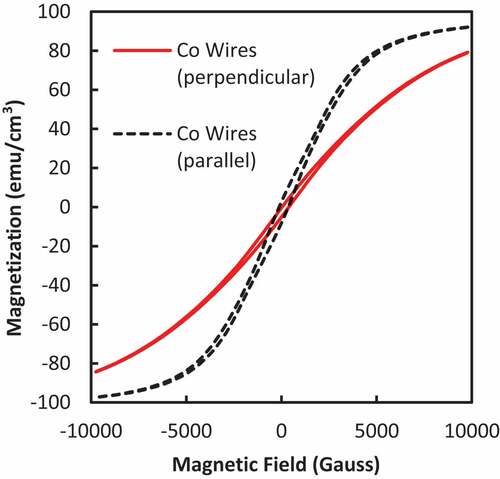
Figure 5. Experimental flow curves for fluids containing 4 vol% 7.05 μm long nanowires with the Bingham-plastic (BP) model fit superimposed (dotted line). The applied magnetic field was varied from 0.00 T (bottom) to 0.96 T (top) in increments of ~0.08 T.
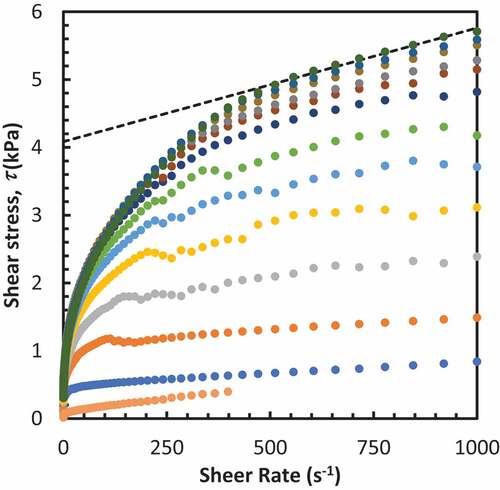
Figure 6. The yield strength versus magnetic field (at a 95% confidence interval) for fluids containing 4 vol. % of 4.82 μm long cobalt nanowires.
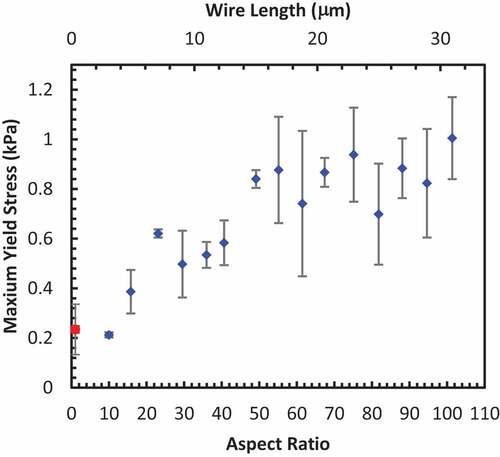
Figure 7. The maximum yield strength (at a 95% confidence interval) of the cobalt microwire-based MR fluids at 4 vol. % increase (diamonds) as the aspect ratio is increased until an aspect ratio of 23 at which time the maximum yield stress plateaus at 3.7 kPa. This is more than double the maximum yield of 1.6 kPa achieved for fluids containing the more conventional spherical particles (circle) at the same loading.
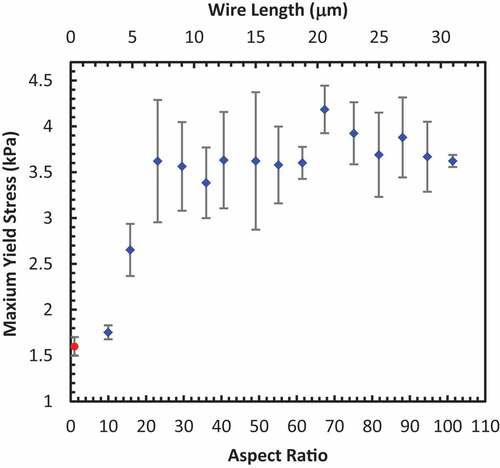
Figure 8. Plot of the increment in yield stress, i.e. the maximum yield stress at maximum field to the field off yield stress, τmax/τ0, versus the wire length clearly display a decrease with increasing wire length.
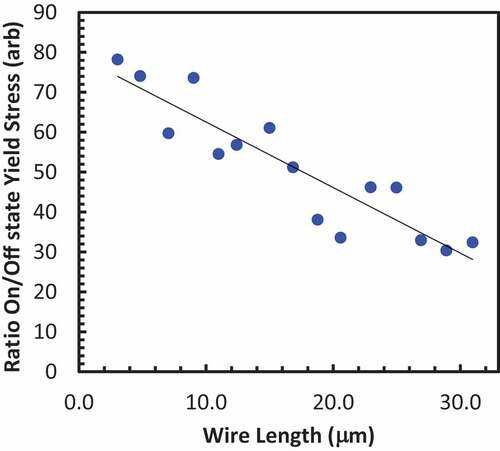
Figure 9. SEM micrographs of (a-c) 7.05, (d-f) 16.84, and (g-i) 30.97 μm long wires at various magnetic fields. The length scale bar represents the size for all image in that column. For the images in (a), (d), and (g), there is no magnetic field applied. The rest of the images are in a 338 mT field.
Figure 10. The off-state viscosity of the cobalt sphere-based (circle) and nanowire-based (diamonds) MR fluids at 4 vol. % (at a 95% confidence interval). The nanowire-based MR fluid viscosity increases as the aspect ratio increases until an aspect of ~50 at which time the viscosity reaches a plateau of approximately 0.85 Pa·s.