
Figures & data
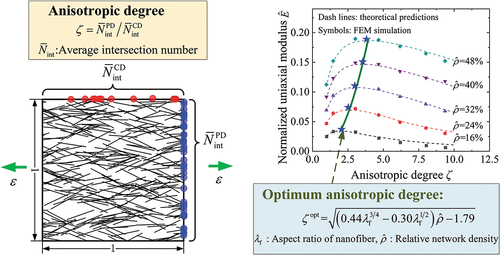
Figure 1. Schematic diagrams of (a) the anisotropic nanofiber network and (b) the definition of fiber number densities on the cross-sections in the preferential direction and its cross direction.
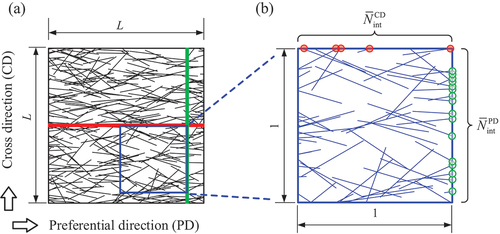
Figure 2. (a-c) The stiffness percolation process of 2D network with the increase of network density and (d) basic forms of small stable clusters (SSC), large stable clusters (LSC) and load-carrying paths (LCP).
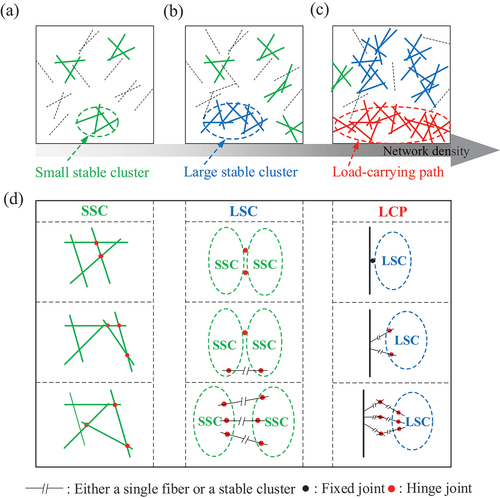
Figure 3. (a) Relations between the load-carrying probability and the network density and (b) normalized stiffness thresholds of networks with different anisotropic degrees (λf = 400).
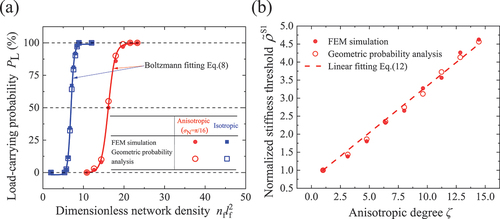
Figure 4. Normalized bending-stretching transitional threshold of networks with different anisotropic degrees (λf = 400).
Figure 5. (a) The relations between the normalized uniaxial modulus and relative network density at different anisotropic degrees and (b) the slopes of the linear regime of curves for networks with different anisotropic degrees (λf = 400).
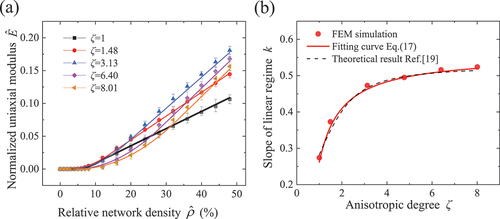
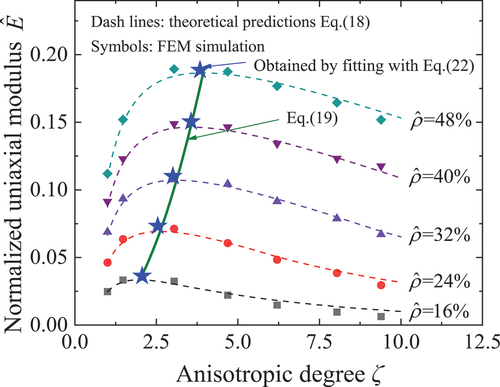
Figure 6. Curves of normalized uniaxial modulus versus anisotropic degree at different network densities (λf = 400).
Data Availability Statement
Data will be made available on request from the corresponding authors.