Figures & data
Figure 1. (a) Mean Young's modulus ratio and (b) standard deviation of Young's modulus ratio for armchair (n,n). • = 2% NRV; ▪ = 1.5% NRV; ▴= 1% NRV; ◊ = 0.5% NRV.
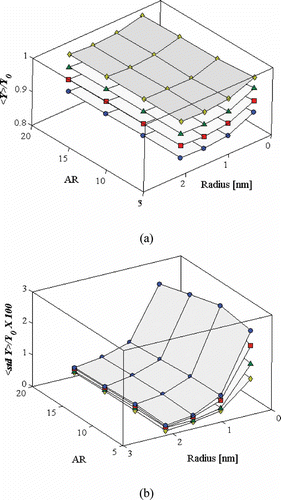
Figure 2. Zigzag (6,0) nanotube (AR = 10, 2% NRD).
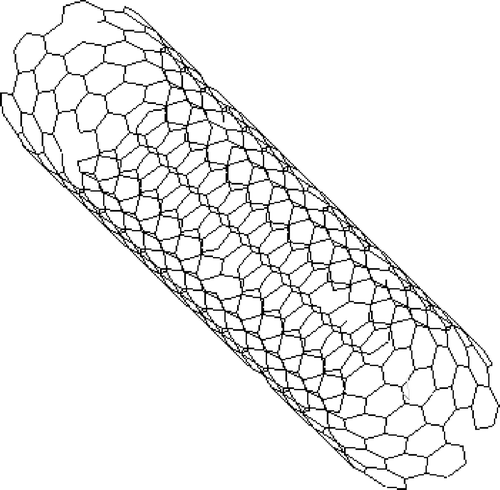
Figure 3. Auxetic (6,0) nanotube (ν = –0.932).
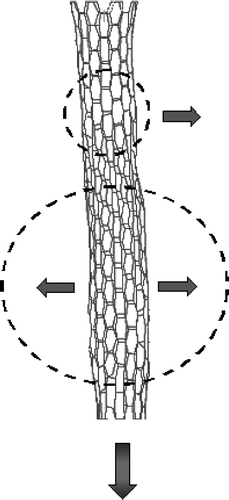
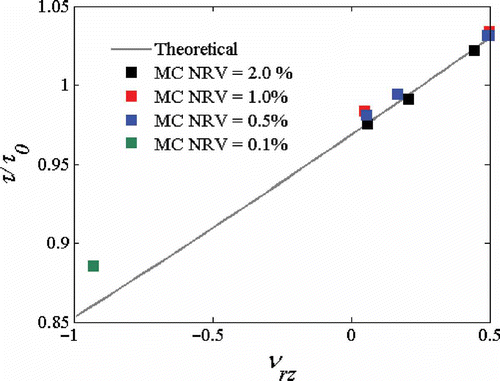
Figure 4. Probability density functions for νrz in (n,n) tubes (R = 0.426 nm, AR = 5).
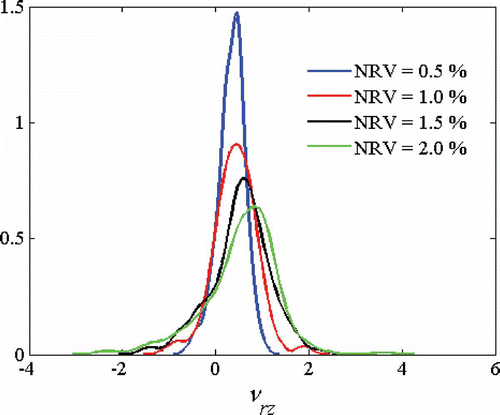
Figure 5. Distribution of the standard deviations for (n,n) configurations (pristine νrz between 0.29 and 0.16).
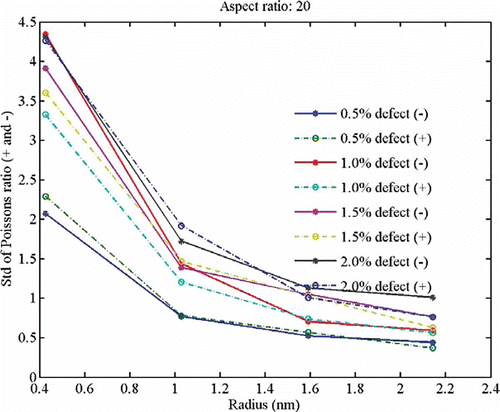
Figure 6. HS bounds for the NRD nanocomposite (a) bulk modulus and (b) shear modulus.
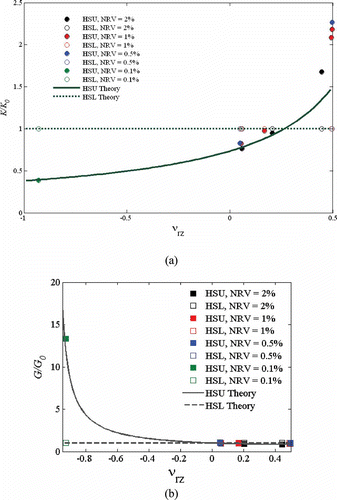
Figure 7. In-plane Poisson's ratio, ν12, for unidirectional reinforced nanocomposites versus volume fraction and CNT Poisson's ratio.
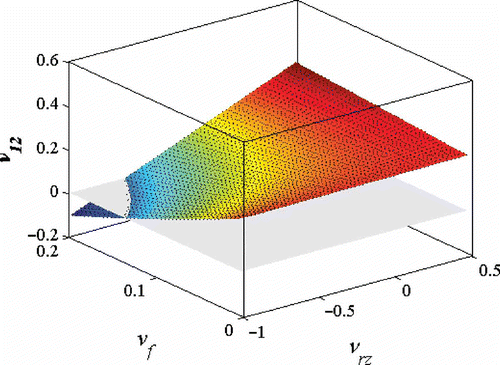
Figure 8. Maximum interfacial shear stress ratio during pullout of the NRD nanofibres.