623
Views
8
CrossRef citations to date
0
Altmetric
Original Articles

The impact of image and class structure upon sub-pixel mapping accuracy using the pixel-swapping algorithm

&
Pages 31-42 | Received 18 Nov 2010, Accepted 19 Dec 2010, Published online: 28 Mar 2011

Figures & data

Figure 1. Pixel-swapping algorithm number of neighbour (n) setting configuration.

Figure 1. Pixel-swapping algorithm number of neighbour (n) setting configuration.

Table 1. Detailed configuration of reference maps

Figure 2. Simulated reference maps with different spatial autocorrelation and class proportions. (a) High spatial autocorrelation and low class proportion difference (H46). (b) Low spatial autocorrelation and low class proportion difference (L46). (c) High spatial autocorrelation and high class proportion difference (H19). (d) Low spatial autocorrelation and high class proportion difference (L19). (e) Medium high spatial autocorrelation and medium class proportion difference (MH37). (f) Medium low spatial autocorrelation and medium class proportion difference (ML37). Class ‘1’ is black and ‘0’ is white.
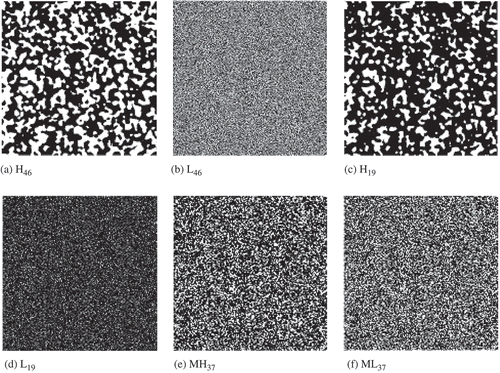
Figure 2. Simulated reference maps with different spatial autocorrelation and class proportions. (a) High spatial autocorrelation and low class proportion difference (H46). (b) Low spatial autocorrelation and low class proportion difference (L46). (c) High spatial autocorrelation and high class proportion difference (H19). (d) Low spatial autocorrelation and high class proportion difference (L19). (e) Medium high spatial autocorrelation and medium class proportion difference (MH37). (f) Medium low spatial autocorrelation and medium class proportion difference (ML37). Class ‘1’ is black and ‘0’ is white.

Table 2. PSA setting optimums given overall accuracies for the H46 and L46 maps

Figure 3. Overall accuracy of PSA output under varying neighbour depth and range settings using the H46 reference map (high spatial autocorrelation and low class proportion difference) at a zoom factor of 10.
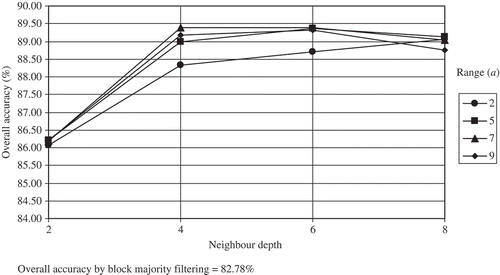
Figure 3. Overall accuracy of PSA output under varying neighbour depth and range settings using the H46 reference map (high spatial autocorrelation and low class proportion difference) at a zoom factor of 10.

Figure 4. Overall accuracy of PSA output under varying neighbour depth and range settings using the L46 reference map (low spatial autocorrelation and low class proportion difference) at a zoom factor of 10.
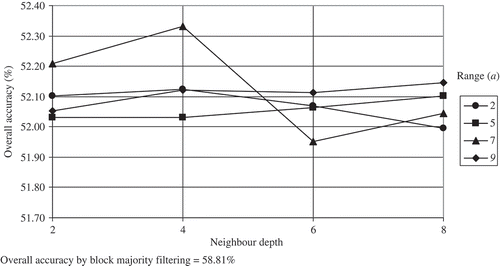
Figure 4. Overall accuracy of PSA output under varying neighbour depth and range settings using the L46 reference map (low spatial autocorrelation and low class proportion difference) at a zoom factor of 10.

Table 3. Overall accuracy of outputs from optimum PSA settings and block majority filtering (BMF) for maps at zoom factors 2, 4 and 10

Figure 5. Comparison of the reference map to outputs from the PSA and BMF for high class spatial autocorrelation and low class proportion map H46 at zoom factor of 10. In the accuracy map (d): white pixels (‘2’) are ‘0’s which are correctly mapped by the PSA; black pixels (‘5’) are ‘1’s’ that are correctly mapped. Lighter grey pixels (‘4’) are ‘1’s’ mapped as ‘0’s’; and darker grey pixels (‘3’) are ‘0’s mapped as ‘1’s).
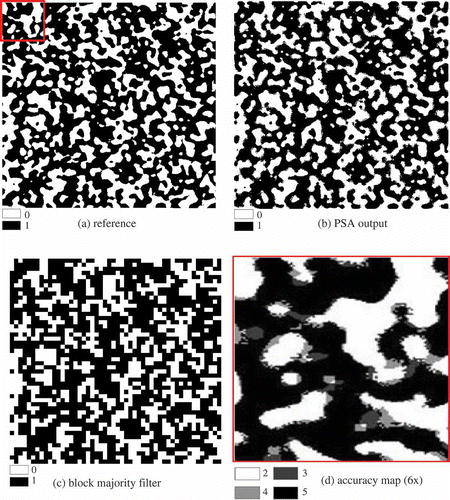
Figure 5. Comparison of the reference map to outputs from the PSA and BMF for high class spatial autocorrelation and low class proportion map H46 at zoom factor of 10. In the accuracy map (d): white pixels (‘2’) are ‘0’s which are correctly mapped by the PSA; black pixels (‘5’) are ‘1’s’ that are correctly mapped. Lighter grey pixels (‘4’) are ‘1’s’ mapped as ‘0’s’; and darker grey pixels (‘3’) are ‘0’s mapped as ‘1’s).

Figure 6. Comparison of the reference map to outputs from the PSA and BMF for low class spatial autocorrelation and low proportion difference map L46 at zoom factor of 10. In the accuracy map (d): white pixels (‘2’) are ‘0’s which are correctly mapped by the PSA; black pixels (‘5’) are ‘1’s’ that are correctly mapped. Lighter grey pixels (‘4’) are ‘1’s’ mapped as ‘0’s’; and darker grey pixels (‘3’) are ‘0’s mapped as ‘1’s.
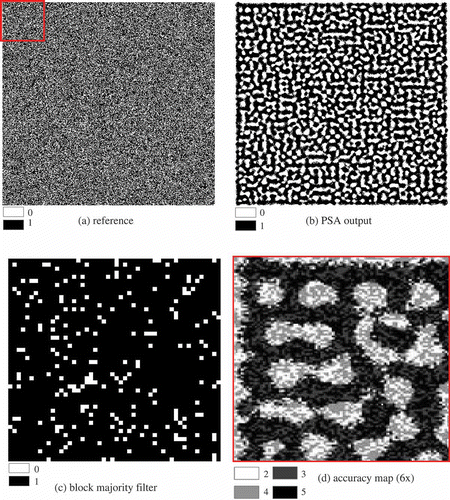
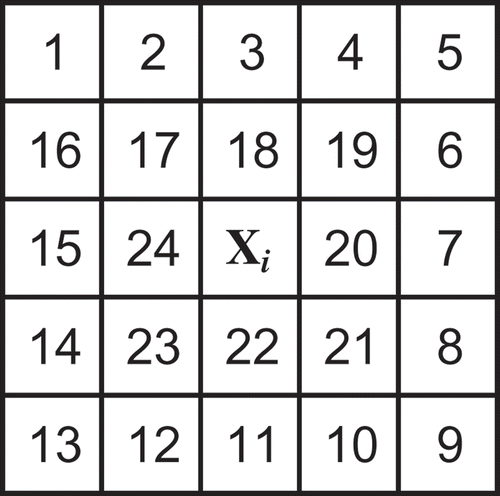
Figure 6. Comparison of the reference map to outputs from the PSA and BMF for low class spatial autocorrelation and low proportion difference map L46 at zoom factor of 10. In the accuracy map (d): white pixels (‘2’) are ‘0’s which are correctly mapped by the PSA; black pixels (‘5’) are ‘1’s’ that are correctly mapped. Lighter grey pixels (‘4’) are ‘1’s’ mapped as ‘0’s’; and darker grey pixels (‘3’) are ‘0’s mapped as ‘1’s.

Table 4. Accuracy comparison for overall and mixed pixel outputs from the PSA and the block majority filtering (BMF) at zoom factor of 2

Reprints and Corporate Permissions

Please note: Selecting permissions does not provide access to the full text of the article, please see our help page How do I view content?

To request a reprint or corporate permissions for this article, please click on the relevant link below:

Academic Permissions

Please note: Selecting permissions does not provide access to the full text of the article, please see our help page How do I view content?

Obtain permissions instantly via Rightslink by clicking on the button below:

If you are unable to obtain permissions via Rightslink, please complete and submit this Permissions form. For more information, please visit our Permissions help page.