2,351
Views
32
CrossRef citations to date
0
Altmetric
Review

NOAA's Coral Reef Watch program from satellite observations

, , &
Pages 83-92 | Received 11 Feb 2011, Accepted 20 Mar 2011, Published online: 22 Jun 2011

Figures & data

Figure 1. CRW nighttime sea surface temperature chart.

Figure 1. CRW nighttime sea surface temperature chart.

Figure 2. CRW sea surface temperature anomaly (SSTA) chart. in °C.

Figure 2. CRW sea surface temperature anomaly (SSTA) chart. in °C.

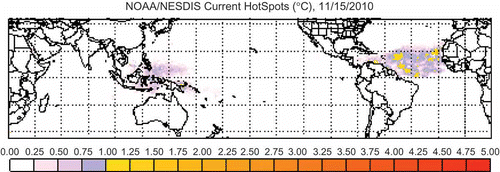
Figure 3. CRW bleaching HotSpot chart. Index values in °C.

Figure 3. CRW bleaching HotSpot chart. Index values in °C.

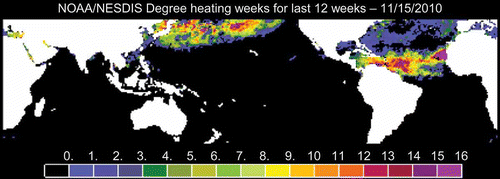
Figure 4. CRW degree heating weeks chart. Values in deg-weeks.

Figure 4. CRW degree heating weeks chart. Values in deg-weeks.

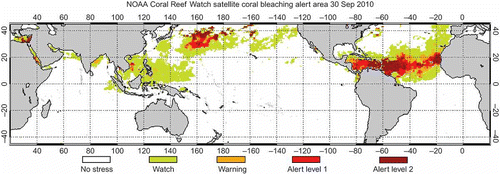
Figure 5. CRW coral bleaching alert area product.

Figure 5. CRW coral bleaching alert area product.

Figure 6. SST and DHW time series graph at Spratly Islands Virtual Station. SST is shown in the center of graphs and read using the vertical axis on the left. DHW is shown in the bottom portion of the graphs and read using the vertical axis on the right. SST and DHW time series for the current year are plotted in thick black solid line. Previous year SSTs, back to 2001, are color coded (see online version) as shown at the top of the graph. When the DHW value is 0, no DHW time series is plotted. The coral bleaching thermal stress level (or alert level) of the present year is color coded (see color legend at bottom of graph) and plotted beneath along the horizontal axis. Three types of information describing the long-term mean conditions about the virtual station site are also provided on the graph (light blue): the monthly mean climatology ( + ), the maximum monthly mean (dashed horizontal line), and the bleaching threshold SST (solid horizontal line).
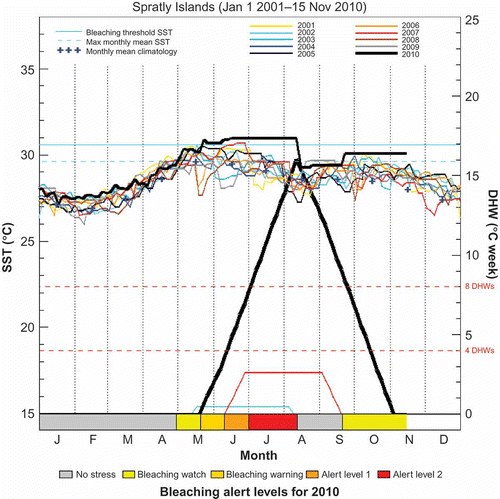
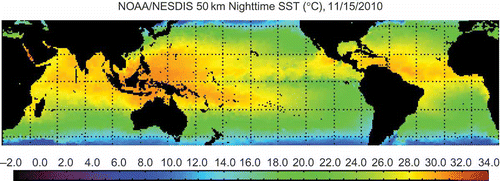
Figure 6. SST and DHW time series graph at Spratly Islands Virtual Station. SST is shown in the center of graphs and read using the vertical axis on the left. DHW is shown in the bottom portion of the graphs and read using the vertical axis on the right. SST and DHW time series for the current year are plotted in thick black solid line. Previous year SSTs, back to 2001, are color coded (see online version) as shown at the top of the graph. When the DHW value is 0, no DHW time series is plotted. The coral bleaching thermal stress level (or alert level) of the present year is color coded (see color legend at bottom of graph) and plotted beneath along the horizontal axis. Three types of information describing the long-term mean conditions about the virtual station site are also provided on the graph (light blue): the monthly mean climatology ( + ), the maximum monthly mean (dashed horizontal line), and the bleaching threshold SST (solid horizontal line).
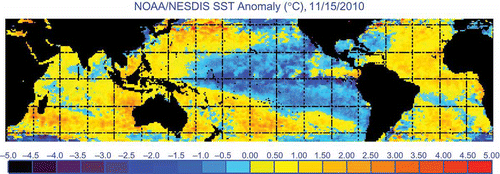
Figure 7. CRW's Caribbean Sea DHWs for October in (a) 2005 and (b) 2010 – for scale see

Figure 7. CRW's Caribbean Sea DHWs for October in (a) 2005 and (b) 2010 – for scale see Figure 4.

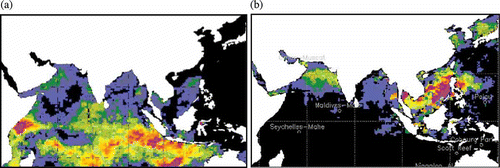
Figure 8. Indian Ocean and Southeast Asian DHWs for (a) May 1998 and (b) August 2010 – for scale see .

Figure 8. Indian Ocean and Southeast Asian DHWs for (a) May 1998 and (b) August 2010 – for scale see Figure 4.

Figure 9. Twenty-five-year satellite SST trends (1985–2009).

Figure 9. Twenty-five-year satellite SST trends (1985–2009).

Figure 10. Tropical [35°N – 35°S] yearly SST means with trends: global tropics and by hemisphere.

Figure 10. Tropical [35°N – 35°S] yearly SST means with trends: global tropics and by hemisphere.

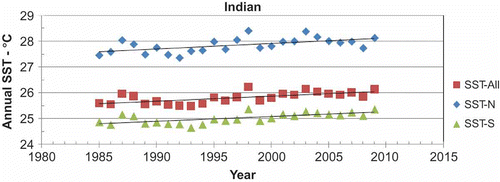
Figure 11. Indian Ocean trends.

Figure 11. Indian Ocean trends.

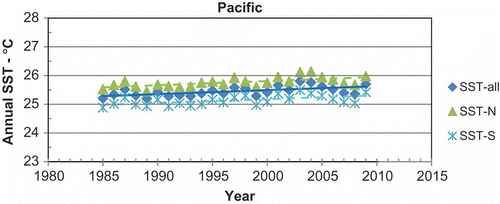
Figure 12. Pacific Ocean trends.

Figure 12. Pacific Ocean trends.

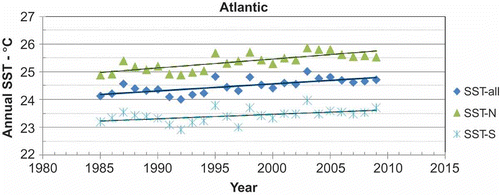
Figure 13. Atlantic Ocean trends.

Figure 13. Atlantic Ocean trends.

Reprints and Corporate Permissions

Please note: Selecting permissions does not provide access to the full text of the article, please see our help page How do I view content?

To request a reprint or corporate permissions for this article, please click on the relevant link below:

Academic Permissions

Please note: Selecting permissions does not provide access to the full text of the article, please see our help page How do I view content?

Obtain permissions instantly via Rightslink by clicking on the button below:

If you are unable to obtain permissions via Rightslink, please complete and submit this Permissions form. For more information, please visit our Permissions help page.