Figures & data
Figure 1. Location of air-quality monitoring stations in Hong Kong (HKEPD, Citation2009).
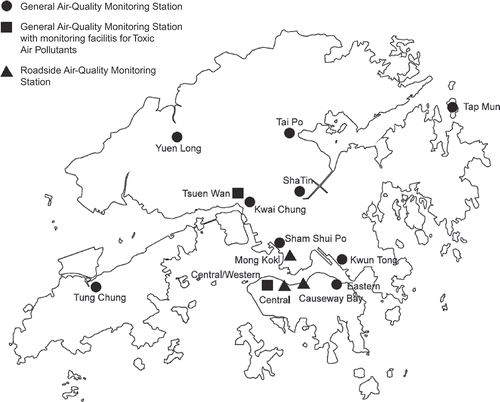
Figure 2. Interannual variation of seasonal RSP.
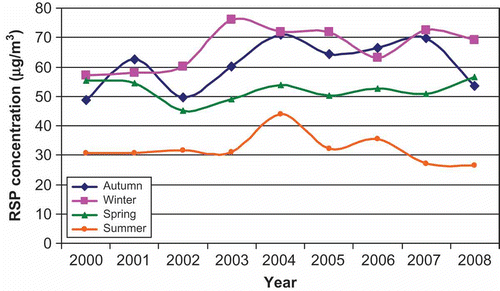
Figure 3. Spatial and seasonal variations of RSP in general monitoring stations in Hong Kong. The center map shows the annual mean distribution of RSP. The inserts show the seasonal variations for each general station (in μg m−3).
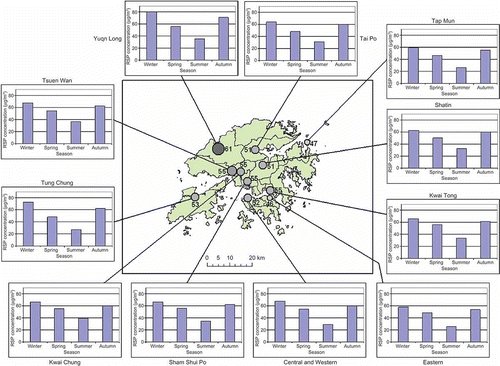
Figure 4. Quartiles and 90 percentile of RSP distribution of annual RSP concentration of 11 general air-quality monitoring stations: (a) Central and Western, (b) Eastern, (c) Kwai Chung, (d) Kwun Tong, (e) Sham Shui Po, (f) Shatin, (g) Tap Mun, (h) Tai Po, (i) Tsuen Wan, (j) Tung Chung, (k) Yuen Long. Straight lines show the 55 μg m−3 threshold. The horizontal and vertical axes show the year and RSP concentration in μg m−3, respectively.
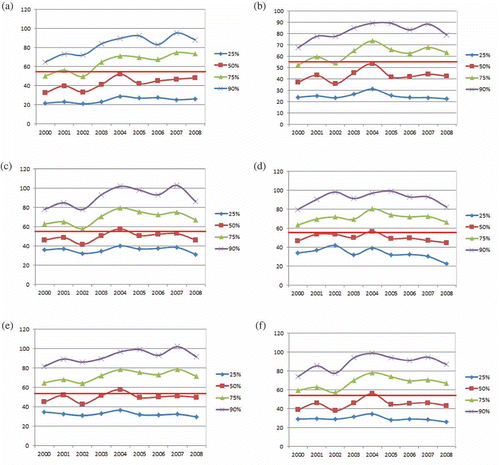
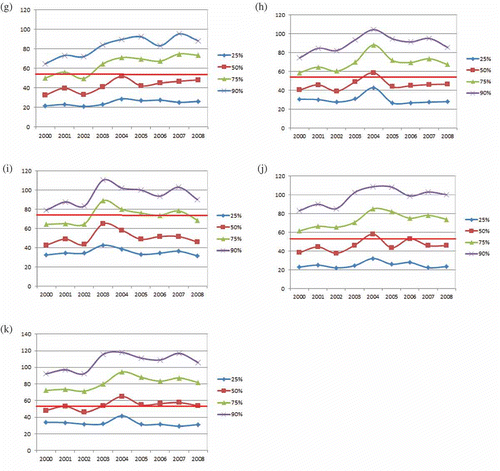
Figure 5. Standardized diurnal cycle of RSP in Hong Kong.
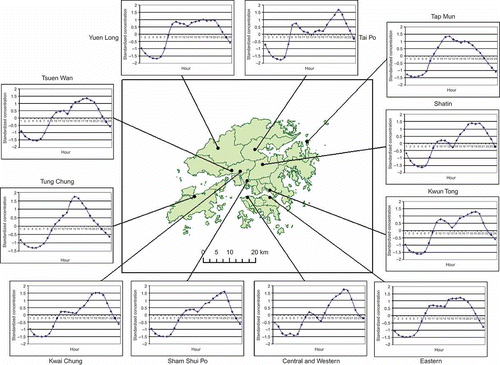
Figure 6. Weekly cycle of RSP with error bars indicates 2 standard errors of estimation.
Figure 7. Climatology of RSP concentration for different wind directions in Shatin, Tap Mun, and Yuen Long.
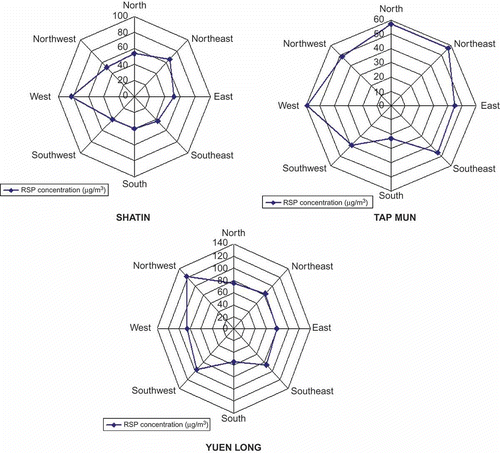
Figure 8. Climatology of RSP concentration with respect to different wind directions in summer and winter seasons in Yuen Long, Tap Mun, and Shatin.
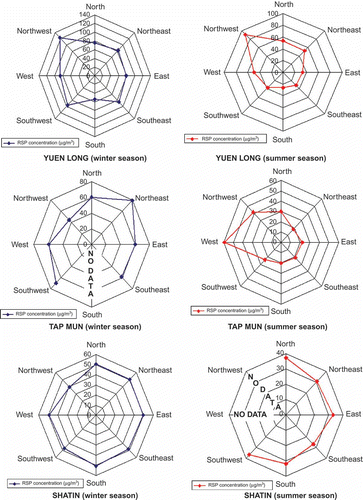
Table 1. Cases of daily RSP that exceed the HKEPD standard of 55 μg m−3 in Yuen Long, Shatin, and Tap Mun from 2000 to 2008
Table 2. RSP concentration under different prevailing wind conditions
Figure 10. Spatial pattern of (a) EOF 1 and (b) EOF 2 for nonseasonal RSP.
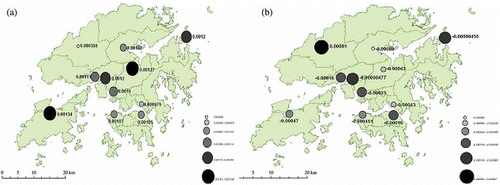
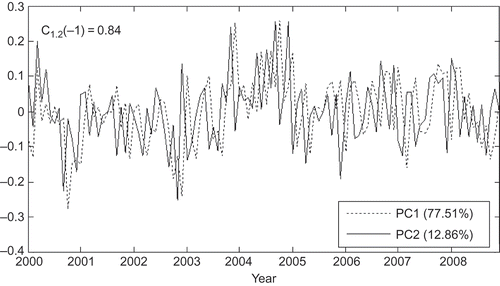
Figure 9. Time series of first and nonseasonal RSP concentrations of EOF for the period 2000–2008 (PC1 and PC2).