
Figures & data
Table 1. Example: computing OWA.
Table 2. Optimal order weights (λk) for selected values of the α parameter and the number of criteria n = 6.
Figure 1. Evaluating socio-economic status of neighbourhoods in the City of London, Ontario: spatial patterns of standardized scores the average-value-of-dwelling criterion generated by (a) global value function, v4(ai), and (b) local value function, v4(aiq).
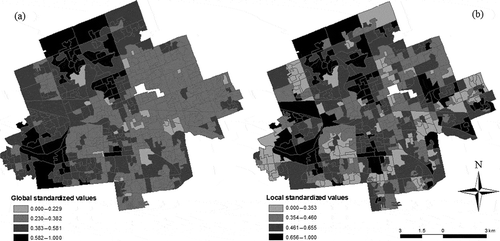
Figure 2. Evaluating socio-economic status of neighbourhoods in the City of London, Ontario: spatial patterns of local criterion weights. (a) Median household income, w1q, (b) incidence of low income, w2q, (c) employment rate, w3q, (d) average value of dwelling, w4q, (e) university education, w5q, and (f) residential burglary, w6q.
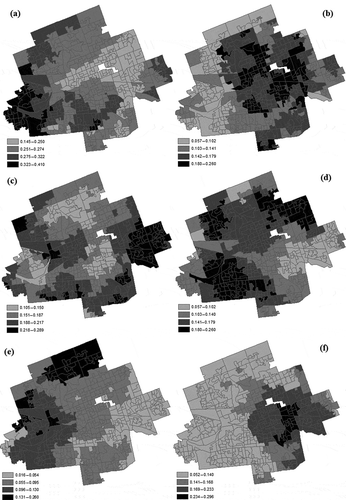
Table 3. Evaluating socio-economic status of neighbourhoods in the City of London, Ontario: the global trade-offs and the average values of local trade-offs.
Figure 3. Evaluating socio-economic status of neighbourhoods in the City of London, Ontario: spatial patterns local criterion ranges of: (a) median income, r1q (b) employment rate, r3q, and (c) the local trade-offs between the median-income and employment criteria (w1q/w3q).
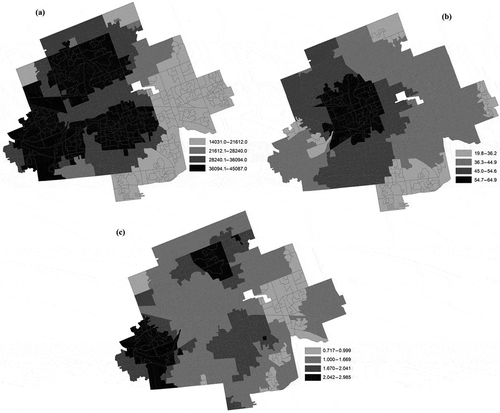
Figure 4. Evaluating socio-economic status of neighbourhoods in the City of London, Ontario: spatial patterns the overall global and local OWA values for: (a) and (d) α = 0.0; (b) and (e) α = 0.5; (c) and (f) α = 1.0.
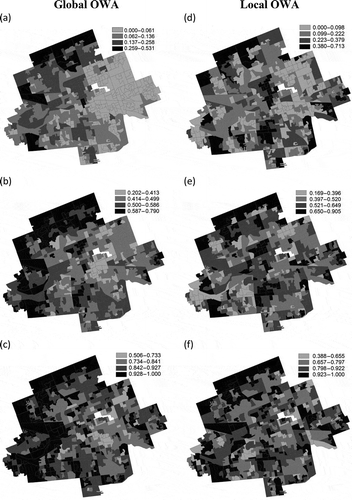
Table 4. Evaluating socio-economic status of neighbourhoods in the City of London, Ontario: the Moran’s I coefficients of the spatial patterns of global and local OWA scores for selected values of α (see ).