
Figures & data
Figure 1. Location and IKONOS panchromatic imagery of study area – Indian Institute of Remote Sensing (IIRS) Campus.
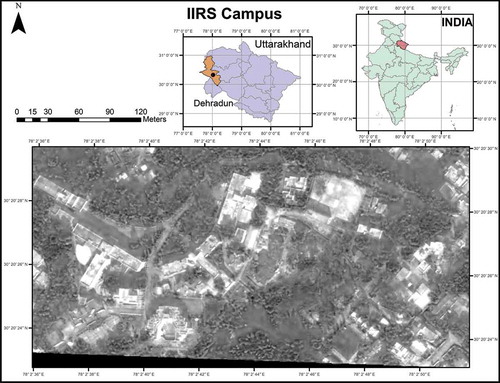
Table 1. 3D data-set standards.
Figure 2. Illustration of CityGML LoD3 building feature structure as UML instance diagram.
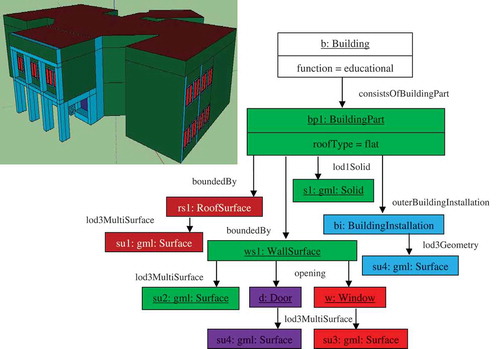
Figure 3. Process workflow between CityGML and energy models.
Figure 4. Methodology.
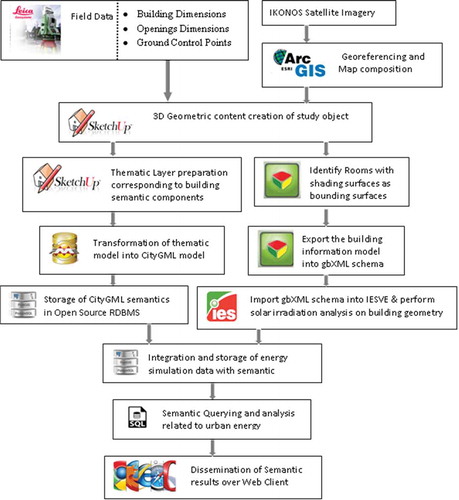
Figure 5. (a) LoD2 building model (b) LoD3 building model with semantics and geometry.
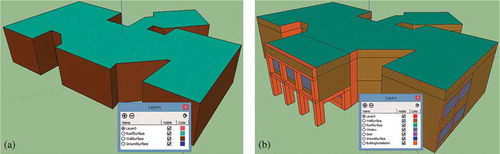
Figure 6. SketchUp to CityGML LoD3 customized converter using FME.
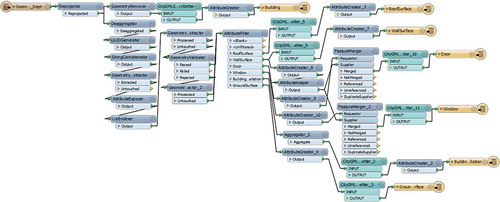
Table 2. Semantic features summary.
Table 3. Percentage of WallSurface areas exposed to insolation.
Figure 7. Developed LoD3 CityGML of Geoinformatics department building rendered using FZK viewer.
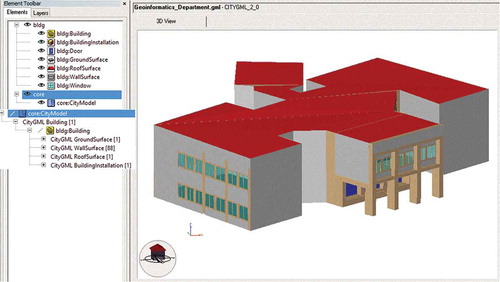
Figure 8. Semantic query results dissemination through Web Client.
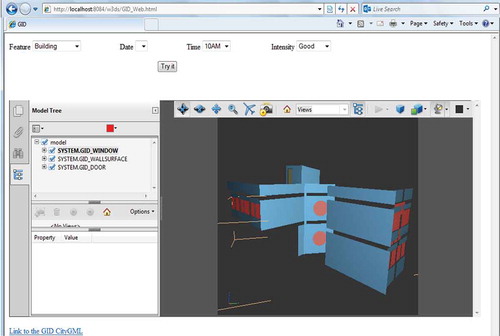
Figure 9. Solar Mapping on Lod2 model.
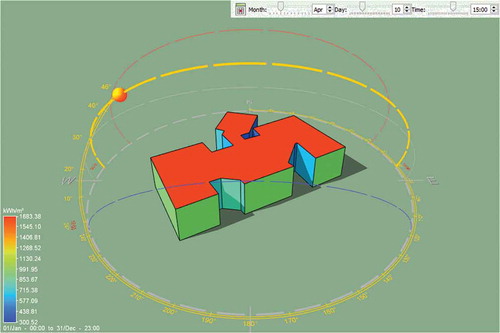
Figure 10. Luminance mapping and glare analysis on LoD3 model.
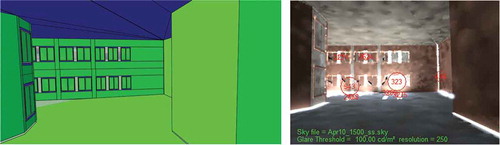
Figure 11. Illuminance mapping on LoD3 model.
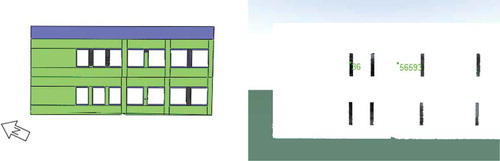
Figure 12. Walls with effective surface areas greater than 10 m2.
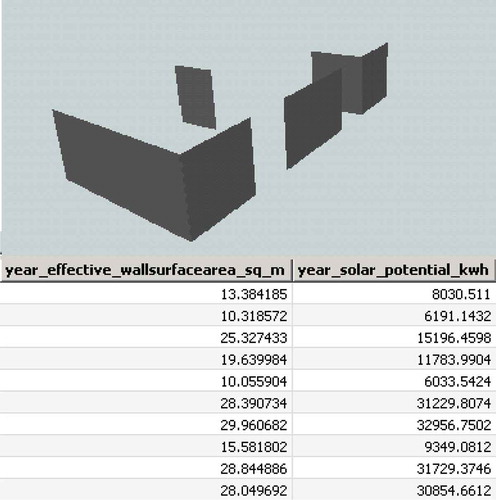
Figure 13. Walls with potential for more than 5 MW of power throughout the year.
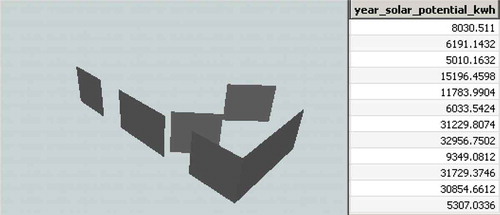
Figure 14. Walls with potential for more than 5 MW of power during winter season.
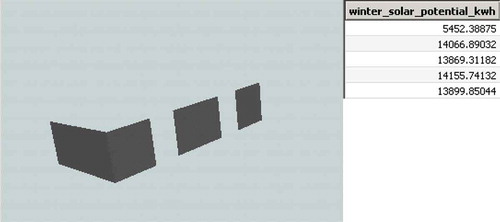
Figure 15. Walls with potential for more than 5 MW of power during summer season.
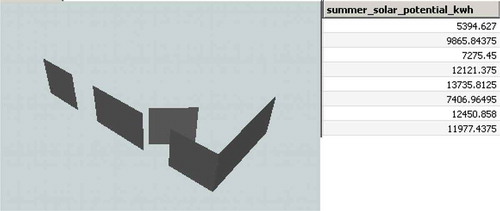
Table 4. Solar illuminance through windows.