Figures & data
Figure 1. Boundaries of the 11 police districts of Republican Beijing (1935).
Table 1. Standard deviational ellipse measures for Chinese temples in the 1920s and 1930s.
Figure 2. Spatial distributions of Chinese temples in 1928 and 1936.
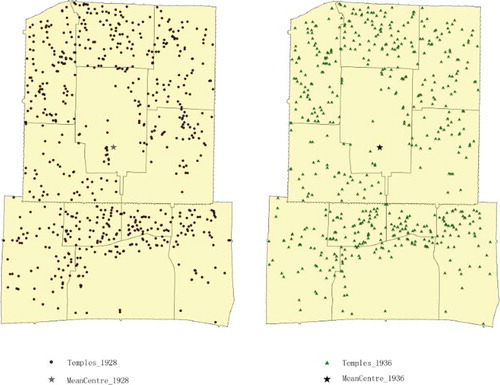
Figure 3. Standard deviational ellipses for Chinese temples in 1928 and 1936.
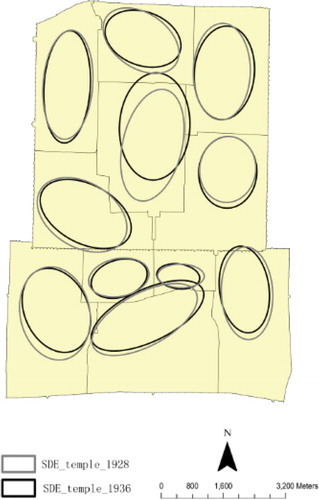
Table 2. Results of global regression model.
Table 3. Comparison of coefficient of determination (R2) between OLS and GWR models.
Table 4. Comparison of Moran’s I of the residuals from OLS and GWR models.
Figure 4. Cluster map of Chinese temples in 1936.
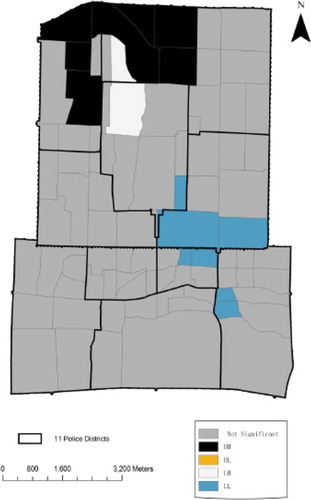
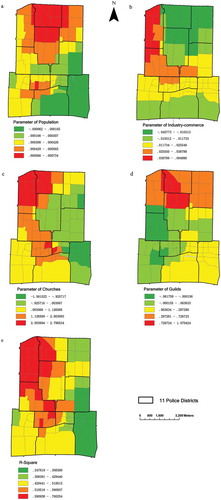
Figure 5. (a–e) Parameter estimates of population, industry-commerce, church, guild and R2.