Figures & data
Figure 1. Pardubice location in the Czech Republic.
Figure 2. Structure of offences dealt with by municipal police in Pardubice in 2014.
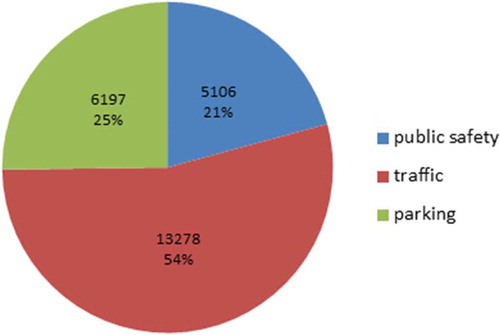
Figure 3. Model Builder scheme used for creating buffer layers and database files with frequency of intersected crimes.
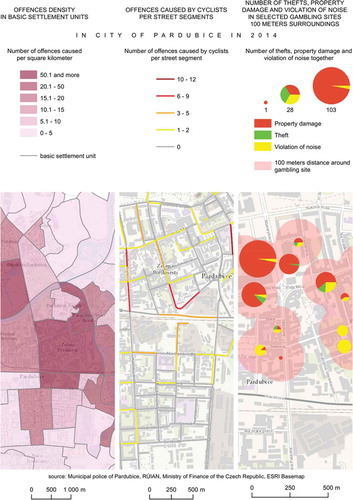
Figure 4. Spatial distribution of gambling sites and selected offences (property damage, violation of noise ordinance and thefts) in the city of Pardubice in 2014.
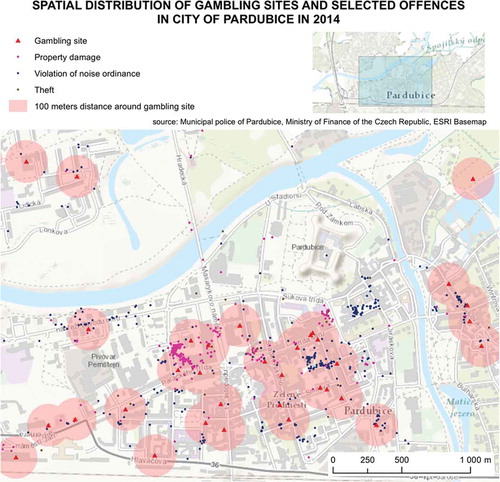
Figure 5. Correlation between value of distance for buffer and relative number of crimes for selected offence types.
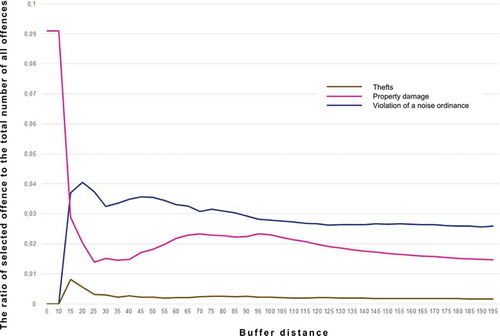
Figure 6. Workflow used for extraction of clusters from points of traffic offences.
Figure 7. Heat map created using kernel density estimation depicting clusters of offences caused by cyclists.
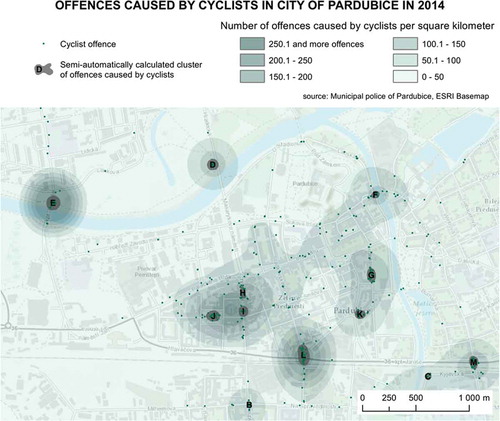
Table 1. List of identified clusters with description of most frequent offence types and proposal of possible solutions.
Figure 8. Hexagon grid used for offence frequency visualization (only non-null hexagons displayed).
Figure 9. Criminal offence data aggregated to basic settlement units (left), cyclists’ offences aggregated to street segments to provide anonymization (in the middle) and quantity of property damage, theft and violation of noise ordinance in vicinity of gambling sites (right).