Figures & data
Figure 1. The location of Taiyuan, Shanxi Province, in northern China and the TM image of Taiyuan with red green blue (RGB) = 432.
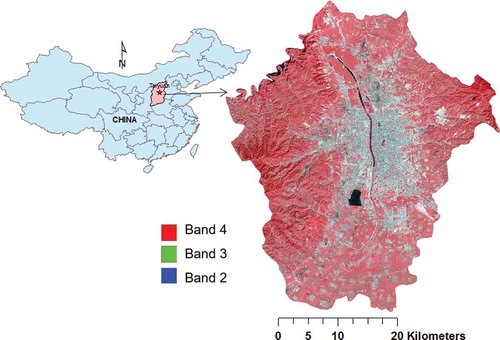
Table 1. The eigenvalues and contribution rates of six principal components after PCA on the original TM image.
Figure 2. Spectral profiles of five typical land features for the original six TM bands (left) and for the first three principal components (right).
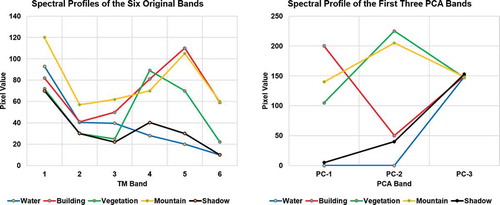
Figure 3. False-colour image with RGB = PC-1, PC-2, MNDWI (left) and the spectral profiles for the five land features (right).
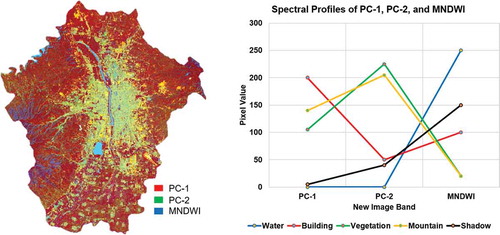
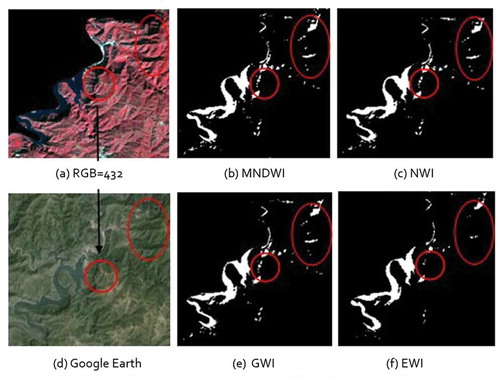
Figure 4. Index images of the study area extracted using different methods: GWI (a), MNDWI (b), NWI (c) and EWI (d).
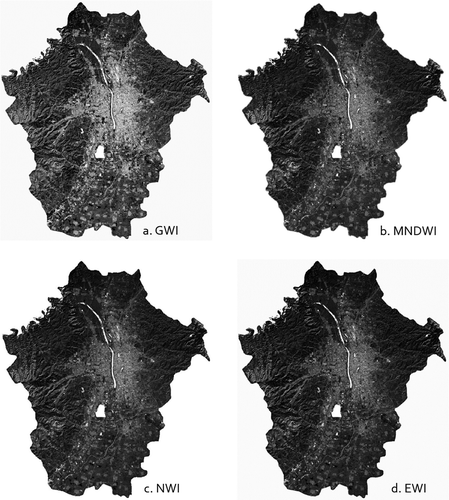
Table 2. Accuracies and visual effects of water bodies extracted from TM image using four water indices.
Figure 5. Shadow removal from water bodies (white colour) in four index images for a small urban area in downtown Taiyuan.
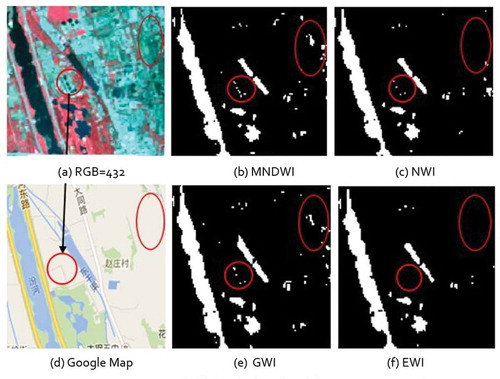
Figure 6. Shadow removal from water bodies (white colour) in four index images for a small mountain area surrounding Taiyuan.