Figures & data
Figure 1. Land use patterns in the contiguous United States. Data are obtained from NLCD 2006.
Colours were defined according to the NLCD 2006 legend.
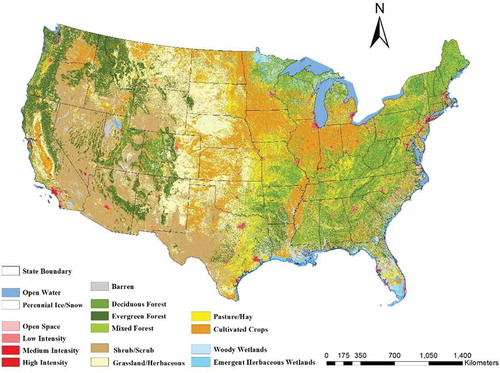
Figure 2. Fishnet in East Baton Rouge County, Louisiana.
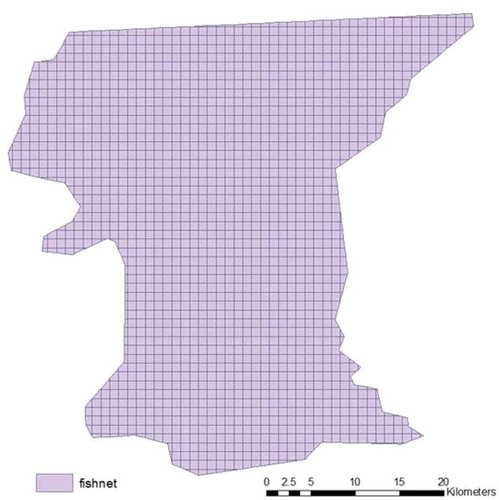
Figure 3. Entropy index standardized Z-score at county level by (a) original method and (b) fishnet method.
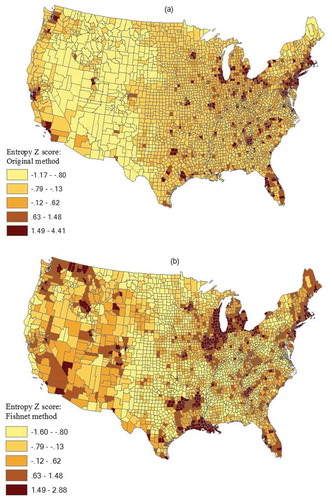
Figure 4. Differences in land use mix (LUM) index at county level by comparing the fishnet method with the traditional method.
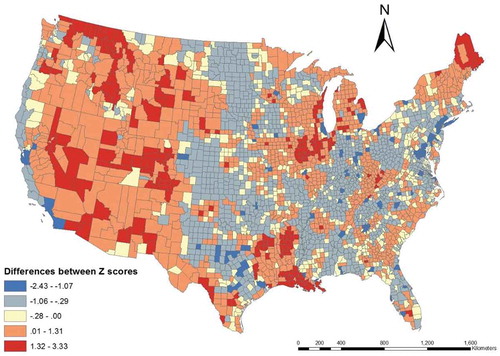
Table 1. Ordinary least square models on obesity rate at the county level.
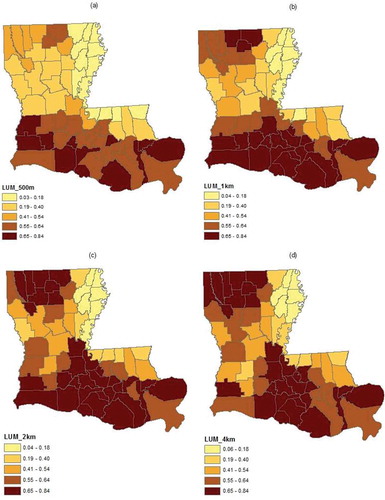
Figure 5. LUM index from different sizes of fishnet: (a) 500 m; (b) 1 km; (c) 2 km; and (d) 4 km.