Figures & data
Table 1. Ward-wise description of Gangtok city (highlighted portion shows the representative site for risk analysis).
Figure 1. Location map of the study area.
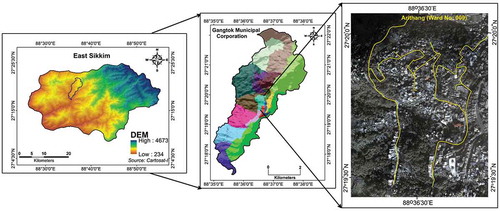
Figure 2. Methodology used to carry out multi-hazard risk analysis (a) section represents the hazard analysis, (b) represents the vulnerability assessment, (c) shows the future approach for multi-hazard risk analysis.
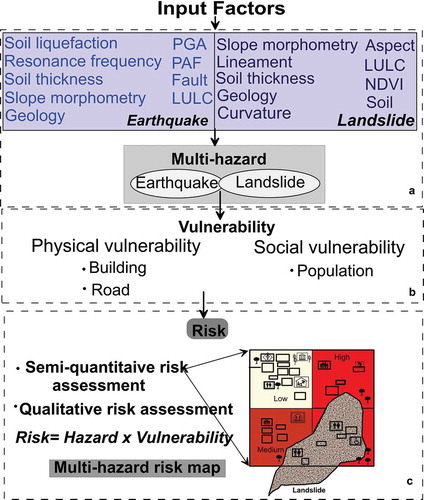
Table 2. Standardized score and weights for different building vulnerability factors.
Figure 3. (a) Building vulnerability map for earthquake hazard, (b) building vulnerability map for landslide hazard.
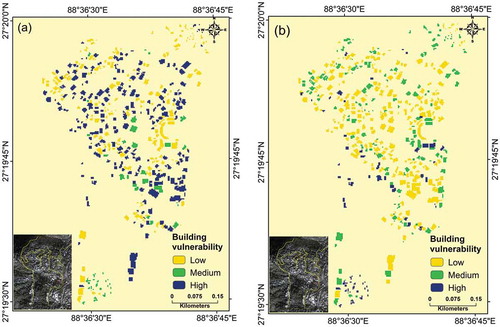
Figure 4. Lifeline vulnerability: (a) road vulnerability due to earthquake (b) road vulnerability due to landslide.
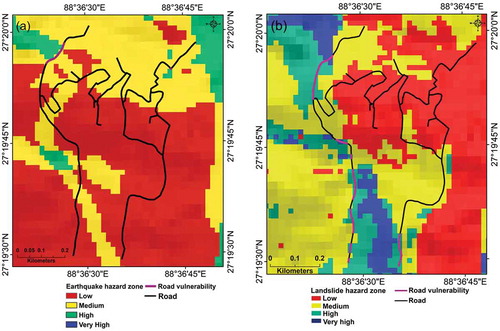
Figure 5. Human vulnerability: (a) for earthquake, (b) for landslide.
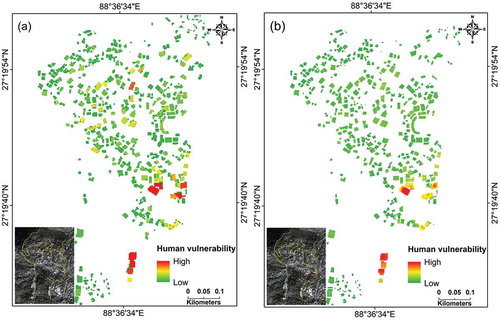
Table 3. Pair-wise comparison matrix of earthquake influencing factors.
Table 4. Pair-wise comparison matrix of landslide influencing factors.
Table 5. Weights, eigenvector values and consistency ratio (CR) of the earthquake hazard derived from pair-wise comparison matrix.
Table 6. Weights, eigenvector values and consistency ratio (CR) of the landslide hazard derived from pair-wise comparison matrix.
Figure 6. Hazard zonation map of (a) earthquake and (b) landslide.
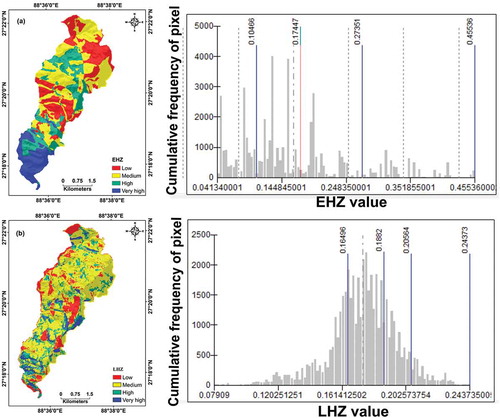
Table 7. Buildings likely to be affected for different landslide hazard classes.
Table 8. Details of summary statistics of the risk index maps along with intermediate maps of vulnerability and hazard values.
Figure 7. Multi-hazard risk map for Arithang ward (009).
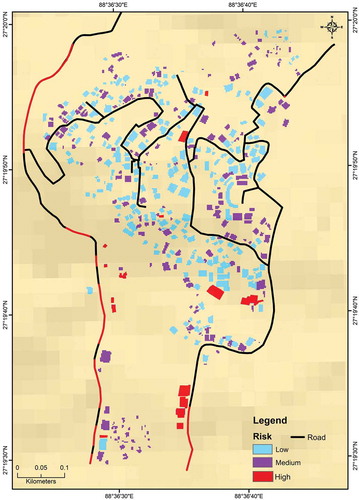
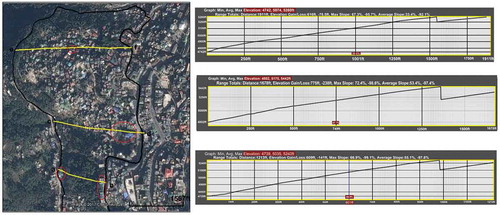
Figure 8. Cross profile plot along the Arithang ward among buildings at high risk.