Figures & data
Figure 1. Landsat 5 image on 17 January 2008 shows the burn scar of Witch Creek Fire (33°9ʹN 116°49ʹW). Band combination – 3:2:1 – red:green:blue. Red line indicates the study area.
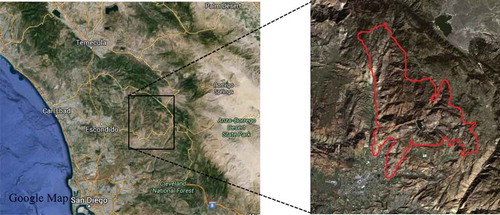
Figure 2. Landsat 5 image on 14 June 2008 shows the burn scar of Anaktuvuk River Fire (69°21ʹN 150°50ʹW). Band combination – 3:2:1 – red:green:blue. Red line indicates the study area.
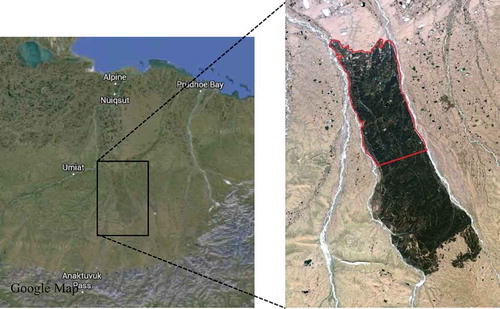
Table 1. Satellite images used for the WCF.
Table 2. Satellite images used for the ARF.
Table 3. Thresholds of burn severity levels as proposed by Key and Benson (Citation2006).
Figure 3. Trends of vegetation regeneration in the cases of WCF and ARF.
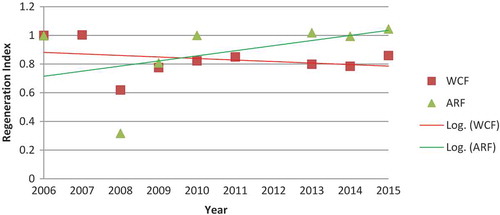
Figure 4. Burn severity classification of WCF.
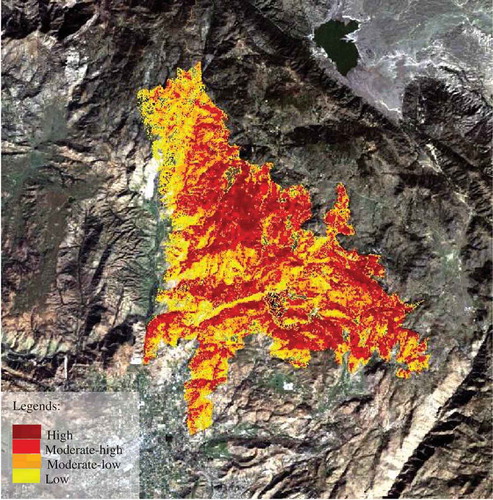
Figure 5. Burn severity classification of ARF. Black colour indicates the wildfire area which was beyond the scope of our study.
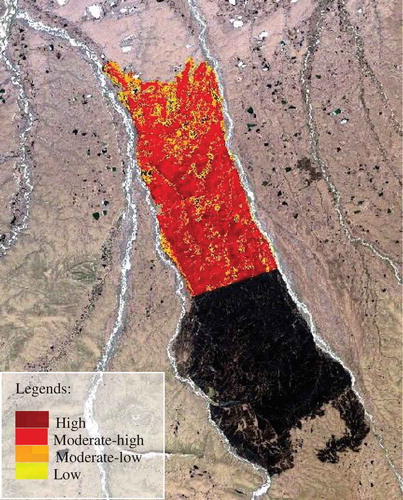
Figure 6. Land cover retrieved from NLCD.
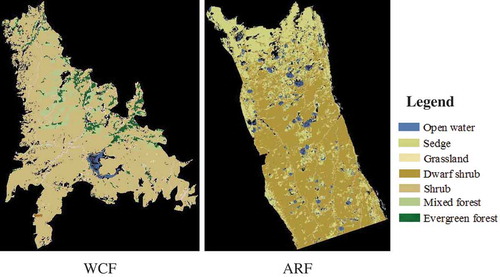
Figure 7. Time series of NDVI of WCF from Landsat images through 2006–2015.
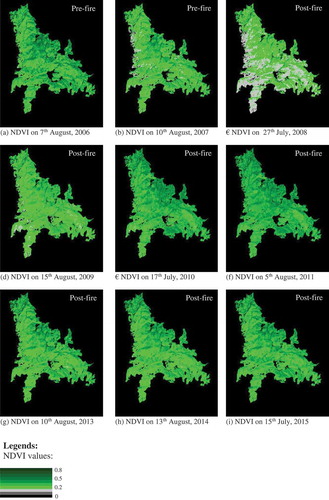
Figure 8. Time series of NDVI of ARF from Landsat images through 2006–2015. Legends refer to .
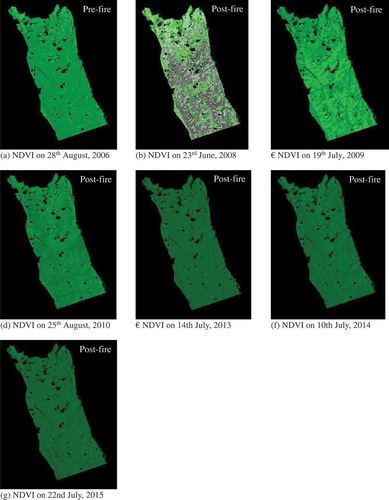
Table 4. Land-cover information extracted from NLCD 2006 for WCF and NLCD 2001 for ARF.
Figure 9. Changes in number of patches after wildfires.
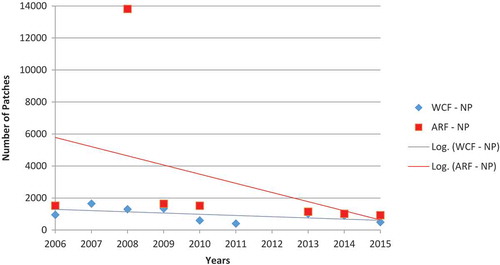
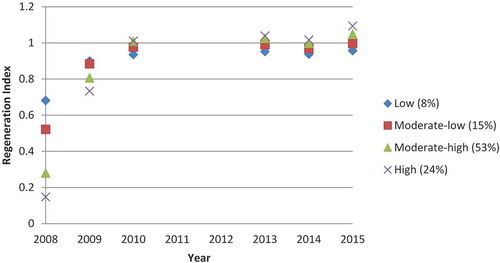
Figure 10. Regeneration index of vegetation under different burn severities in WCF. Note that there is a lack of data in 2012.
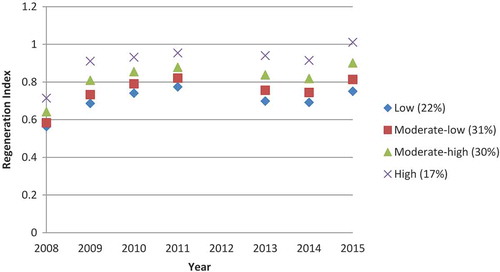
Figure 11. Regeneration index of vegetation under different burn severities in ARF. Note that there is a lack of data in 2011 and 2012.