Figures & data
Figure 1. (a) Satellite picture of Monastir with the localization of the demolished area of the Medina; (b) Monastir Medina picture in 1956 before demolition; (c) Monastir picture in 1994 after demolition.
Figure 2. (a) Map of the project of Cacoub with the localization of the historic and the new centre of Monastir in 1974; (b) Monastir Medina picture in 1960; (c) Monastir Medina picture in 1964; (d) Monastir Medina picture in 1974. (e) Monastir Medina picture in 1980.
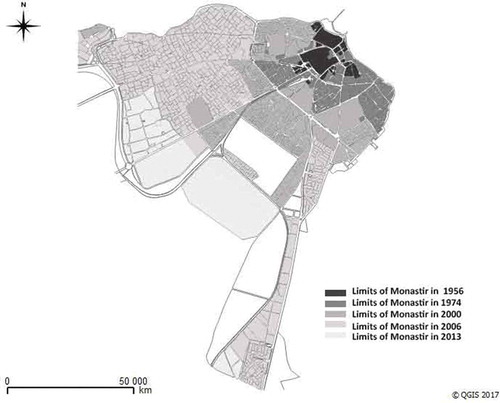
Figure 3. Morphological phases of Monastir urban sprawl (from above to below): (1956), (1974) and (2013).
Figure 4. Axial maps for the three temporal phases of the analysis (from above to below): 6a (1956), 6b (1974) and 6c (2013).
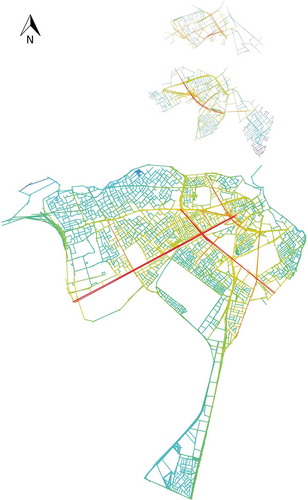
Table 1. Summary of measures in the city of Monastir through three periods of development (1956, 1974 and 2013).
Figure 5. Integration and choice urban maps in 1956.
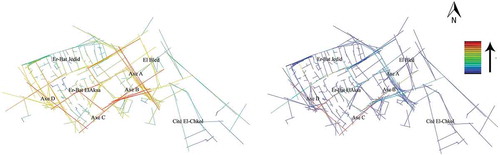
Figure 7. Integration (Rn) and choice (Rn) maps in 2013 *with high n values.
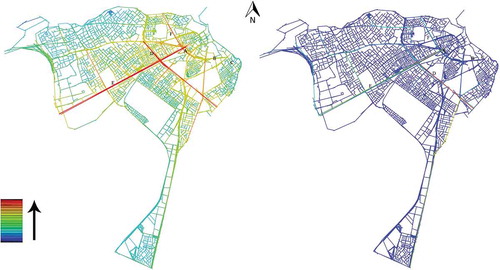
Figure 8. Localization of centres and emergence of linear centralities.
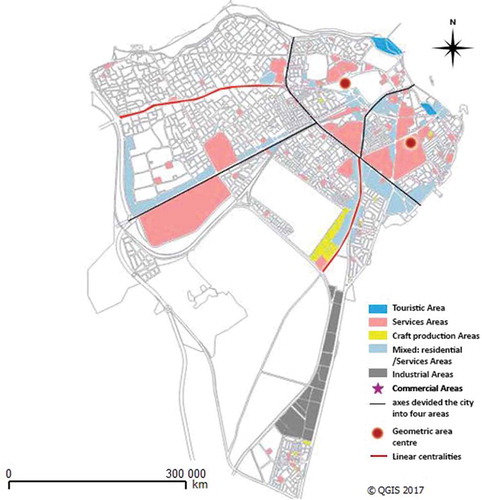
Figure 6. Integration (Rn) and choice (Rn) maps in 1974 *with high n values.
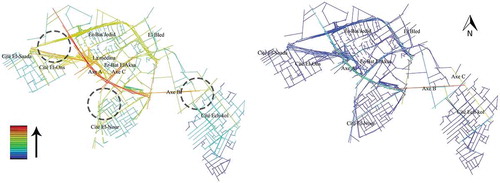
Figure 9. Main planning features and historical morphological phases of Monastir.