Figures & data
Figure 1. Location of BSWC in Córdoba – Colombia.
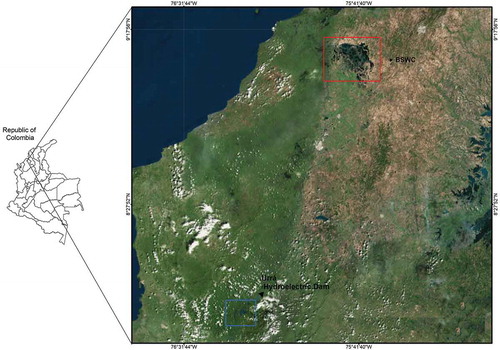
Figure 2. Methodological phases.
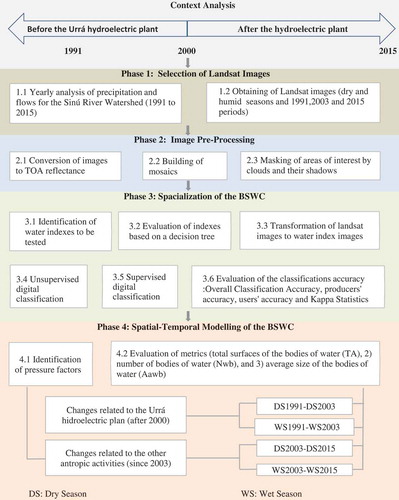
Table 1. Selected scenes for spatio-temporal modelling of BSWC.
Figure 3. Selection of Landsat images based on seasonal rainfall conditions.
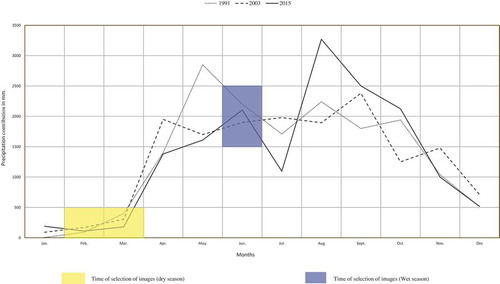
Table 2. Water indexes used in different scientific research projects.
Figure 4. Decision tree for index selection.
Table 3. Raster operations used for modelling the dynamics of the BSWC. (DS: Dry season, WS: Wet season).
Figure 5. (a) Infrared colour composition. (b) NDWI Image (Xu Citation2006).

Figure 6. (a) WRI index, (b) NDMI index, and (c) NDWI (Xu Citation2006).
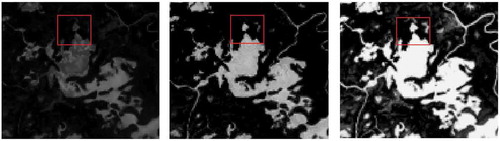
Table 4. Results of the accuracy assessments of digital classifications.
Table 5. Metrics associated with BSWC for inter-seasonal and inter-annual periods.
Figure 7. (a) Location of permanent waterbodies (dry season) in 1991 and (b) location of permanent waterbodies in 2003.
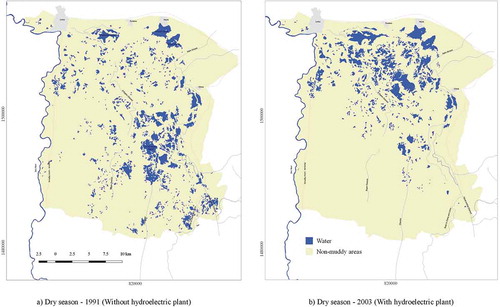
Figure 8. Spatiotemporal dynamics of the BSWC for wet season in 1991 and 2003.
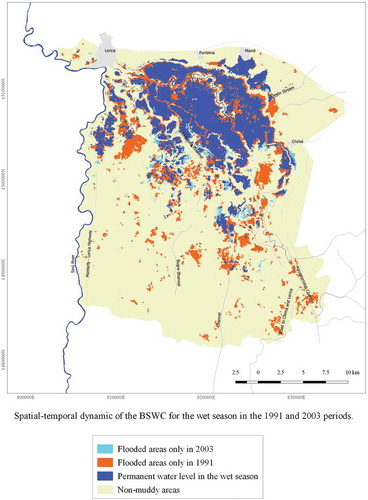
Figure 9. (a–c) Disappearance of permanent waterbodies in BSWC between 1991, 2003 and 2015.
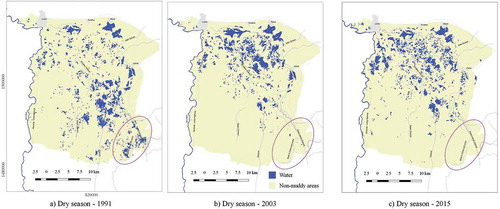
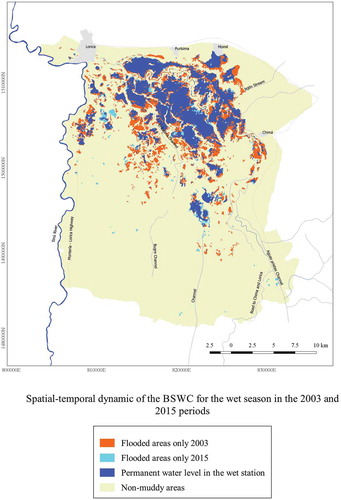
Figure 10. Spatio-temporal dynamics of BSWC for wet season in 2003 and 2015 periods.