
Figures & data
Figure 3. Top of Atmospheric Radiance Images: (A) ETM+ (B) ASTER B15 (C) TM.
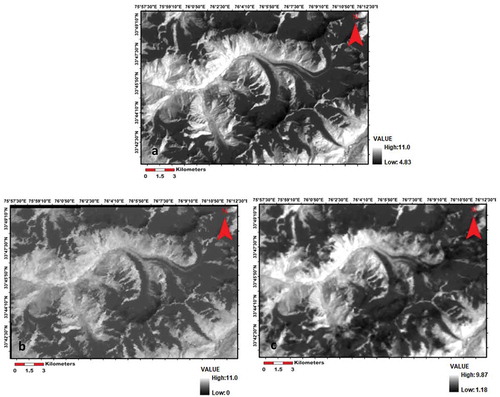
Figure 4. Surface Radiance Images: (A) ETM+ (B) ASTER B15 (C) TM.
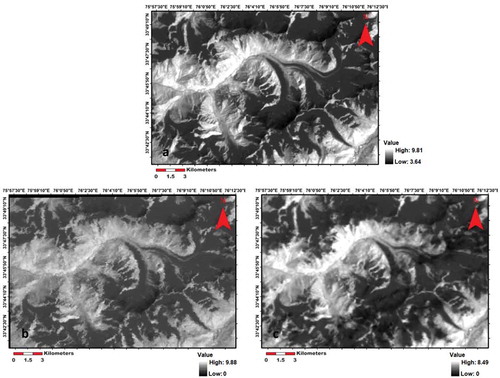
Figure 1. Location Map of the Study Area (North-western part of Chenab valley J&K, India).
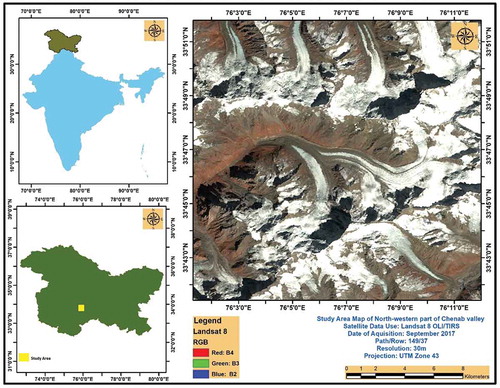
Table 1. Detailed information of the Data sets used.
Figure 2. Schematic flowchart methodology used for LST estimation.
Table 2. Gain and Bias values used (Source: https://landsat.usgs.gov/calibration).
Table 3. UCC values used (Source: Abrams and Hook Citation2001).
Table 4. Atmospheric profile values acquired from web-based atmospheric correction parameter calculator (Source: http://www.ncep.noaa.gov/).
Table 5. Emissivity values of different land cover features used.
Figure 5. Classified image.
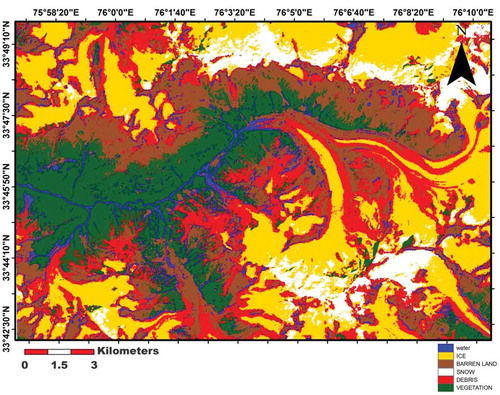
Figure 6. Emissivity Map.
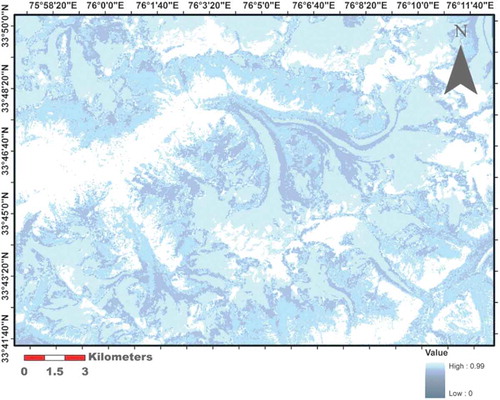
Table 6. Pre-calibrated constant values (Abrams and Hook Citation2001).
Figure 7. Brightness temperature images: (a) ETM+ (b) ASTER B15 (c) TM.
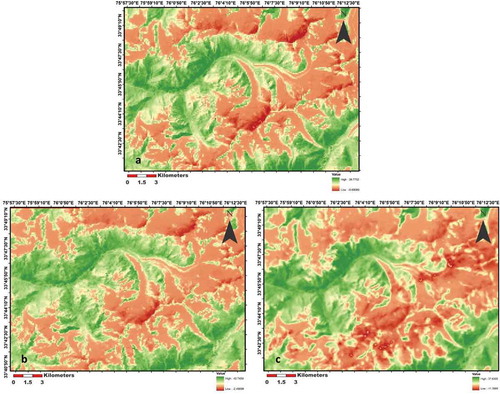
Figure 8. ASTER 08 Image.
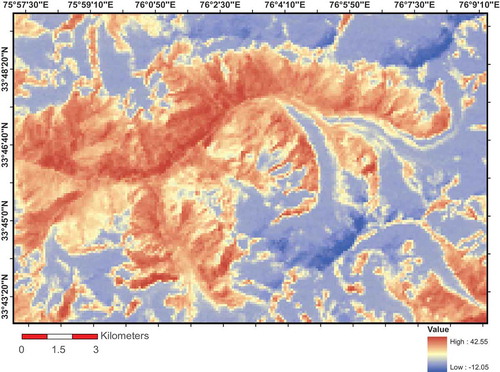
Figure 9. Derived LST images for ASTER B15 (Keywords: (CBA) Classification-based Approach, (SBL) Stefan Boltzmann’s Law, (NEM) Normalization Emissivity Method, (RCM) Reference Channel Method.
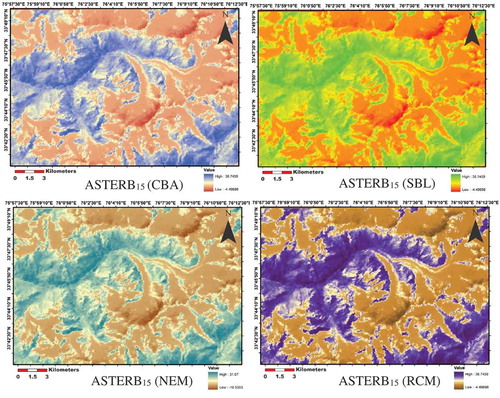
Table 7. Histogram statistical data pertaining to derived ASTER images and the reference image.
Table 8. NRMSE, RMSE and correlation values for ASTER B15 (LST) images. (Keywords: (CBA) Classification Based Approach, (SBL) Stefan Boltzmann’s Law, (NEM) Normalization Emissivity Method, (RCM) Reference Channel Method.
Figure 10. Derived ETM+ images for ASTER B15 (Keywords: (CBA) Classification-based Approach, (SBL) Stefan Boltzmann’s Law, (NEM) Normalization Emissivity Method, (RCM) Reference Channel Method.
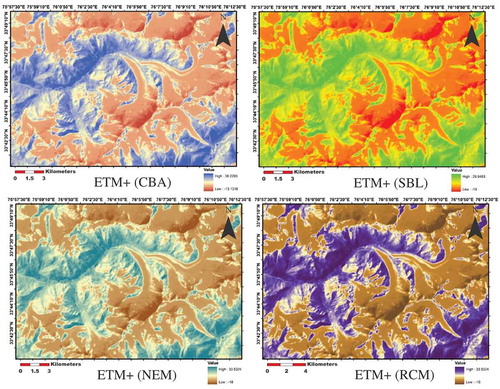
Table 9. Histogram statistical data pertaining to derived ETM+ images and reference image.
Table 10. NRMSE, RMSE and correlation values for ASTER B15 (ETM+) images. (Keywords: (CBA) Classification Based Approach, (SBL) Stefan Boltzmann’s Law, (NEM) Normalization Emissivity Method, (RCM) Reference Channel Method.
Figure 11. Derived TM images for ASTER B15 (Keywords: (CBA) Classification Based Approach, (SBL) Stefan Boltzmann’s Law, (NEM) Normalization Emissivity Method, (RCM) Reference Channel Method.
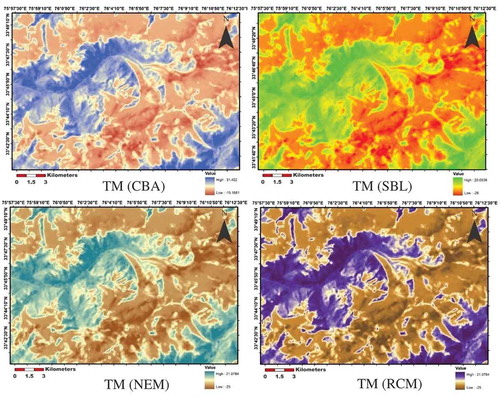
Table 11. Histogram statistical data pertaining to derived ETM+ images and reference image.
Table 12. NRMSE, RMSE and correlation values for ASTER B15 TM images. (Keywords: (CBA) Classification Based Approach, (SBL) Stefan Boltzmann’s Law, (NEM) Normalization Emissivity Method, (RCM) Reference Channel Method.
Figure 12. Re-scaled ETM+ & TM.
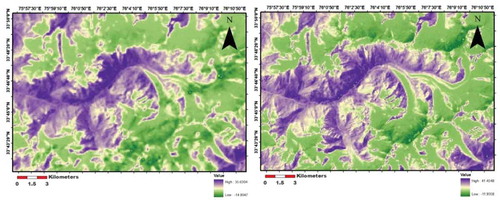
Table 13. Statistical data for Re-scaled ETM+, TM and ASTER08.
Table 14. Estimated correlation and average deviation values for re-scaled image.
Table 15. Statistical figures for Entropy images.
Figure 13. Entropy images.
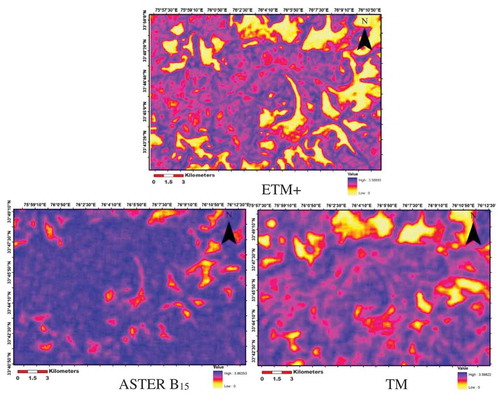
Figure 14. Location of line segments used for spatial profile.
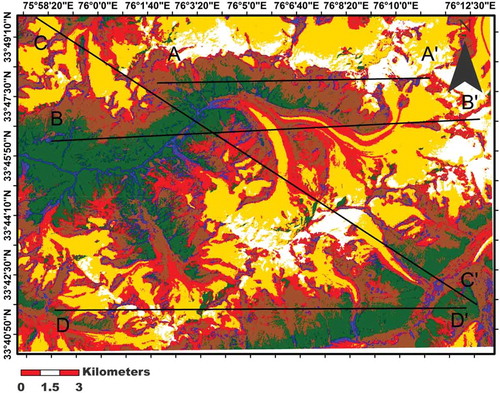
Figure 15. (a): Spatial profile for line segment A for Landsat ETM+, ASTER B15, Landsat TM sensor typed LST image. (b): Spatial profile for line segment B for Landsat ETM+, ASTER B15, Landsat TM sensor typed LST image. (c): Spatial profile for line segment C for Landsat ETM+, ASTER B15, Landsat TM sensor typed LST image. (d): Spatial profile for line segment D for Landsat ETM+, ASTER B15, Landsat TM sensor typed LST image.
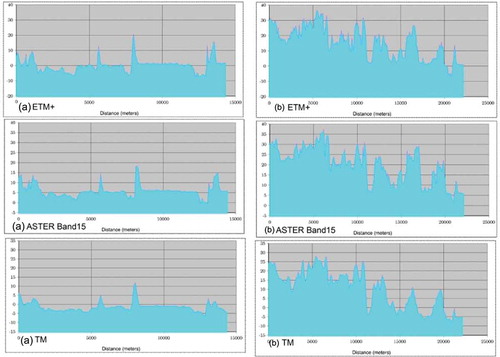
Figure 15. (Continued).
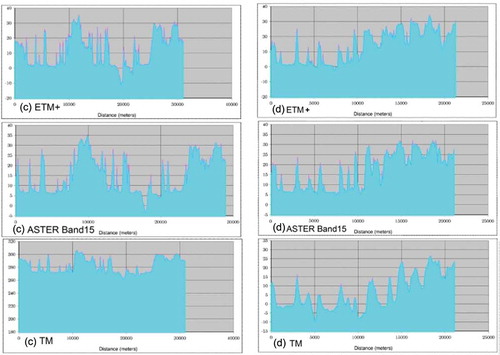
Table 16. Average deviation values between ETM+ and TM.
Figure 16. Observed Points.
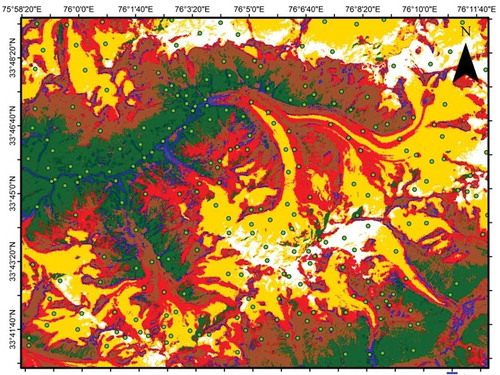
Table 17. Average deviation between ASTER B15 and ETM+.
Table 18. RMSE, NRMSE values of ETM+ with TM and ASTER image.