Figures & data
Figure 7. Area, level and volume changes for three Aral Sea basins during 2000–2015.
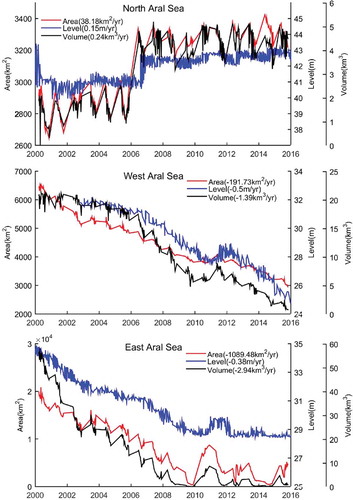
Figure 1. Aral Sea watershed with MODIS bands 2, 1, 4 acquired in July 2000.
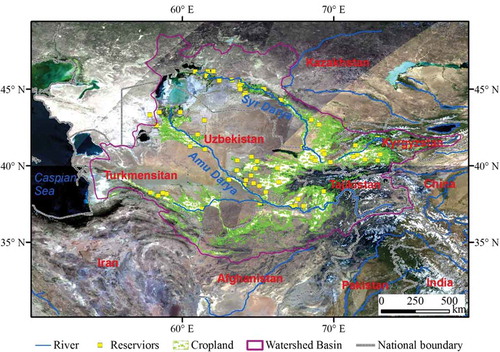
Figure 2. Flowchart of water extraction. The procedure in small red rectangles was the same as that of the large red rectangle.
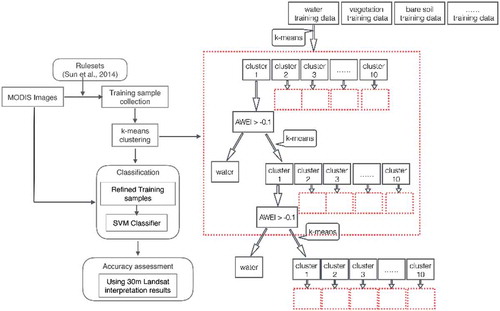
Figure 4. Maxima and minima Sea surface extent for the past 16 years of 2000–2015 (a-q), Inundation Frequency map (r) and contour map (s).
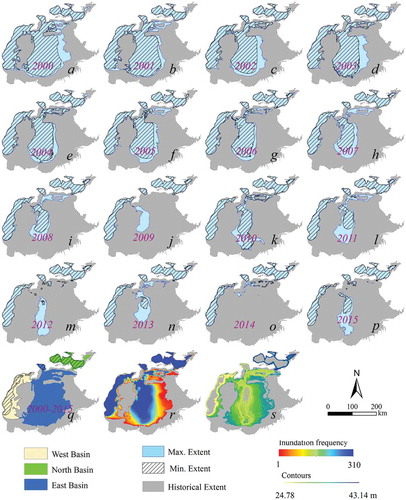
Figure 3. Comparison between In-situ water level (2000–2009) and DAHITI for Aral Sea, North Basin and South Basin, which includes west and east parts.
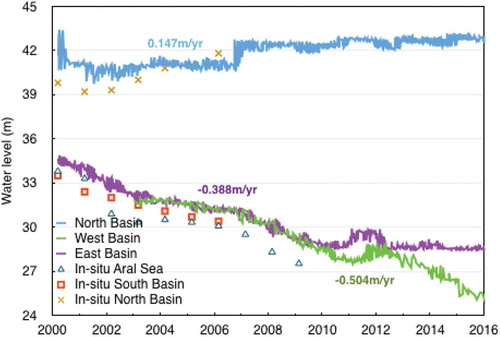
Table 1. In situ hydrological observations of Aral Sea during 2000–2010.
Table 2. The max. and min. area in each year of 2000–2015.
Figure 5. Area of Aral Sea and the occurrence dates. The interval of x-axis is 16 days. The black points represent 10% of the largest values, and the yellow points denote 10% of the smallest values.
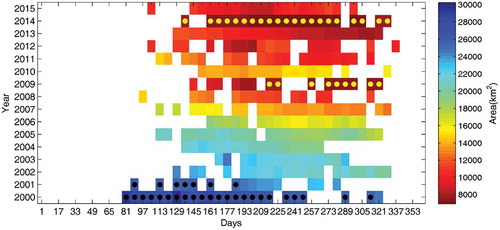
Figure 6. Intra-annual area changes of Aral Sea during 2000–2015. The y axis indicates the annual extent and the pairs of values in the same colour (blue or black) imply the yearly maximum and minimum inundations.
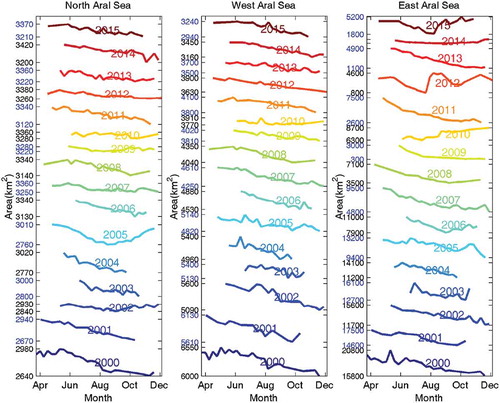
Figure 8. The comparison between in situ water storage changes (2000–2010) and the studied results about the North Bain and South Basin, which includes west and east parts.
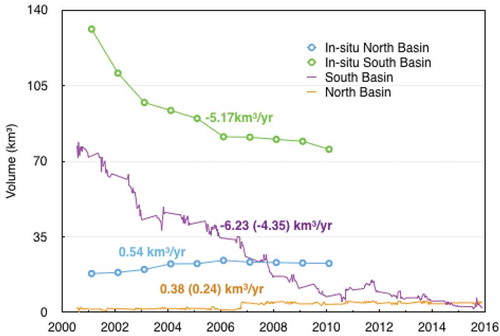
Figure 9. Trend map of precipitation in the watershed (a), the corresponding volume of precipitation in local Aral Sea region (indicated by the red rectangle in a) and the studied water volume changes of Aral Sea (b).
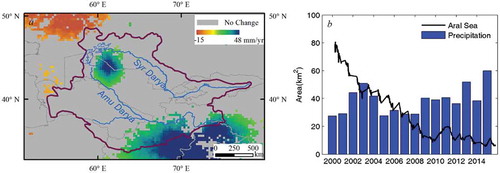
Figure 10. Trend map of GRACE water equivalent depth in the watershed (a), water volume changes estimated through GRACE data for watershed and local Aral region (indicated by the red rectangle in a) during 2002–2015 and the studied water volume changes of Aral Sea (2000–2015). Watershed volume variance is indicated through blue line and based on the right blue y axis (b).
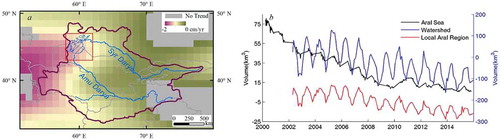
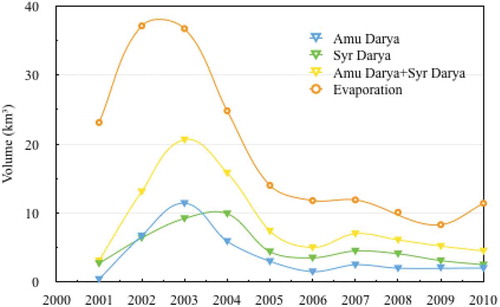
Figure 11. Hydrological observation data (2001–2010) of Aral Sea (Gaybullaev, Chen, and Gaybullaev Citation2012).