
Figures & data
Table 1. Description of the data.
Figure 1. The stretch of highway I 880 at which the mobile century experiment took place, with road segments and locations of inductive loop detectors.
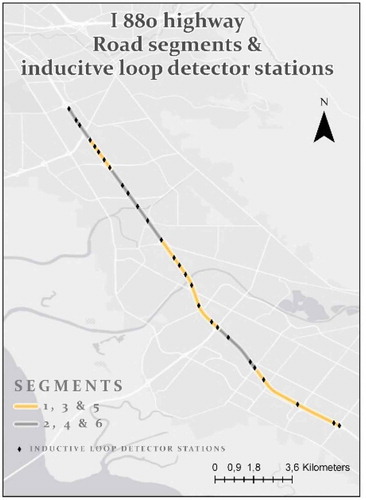
Table 2. Fuzzy inference model output parameter (level of congestion) interpretation set-up.
Table 3. Fuzzy if–then rules with AND operator.
Figure 2. Fuzzy inference model with two input variables (flow and density of the vehicles) and one output (level of congestion).
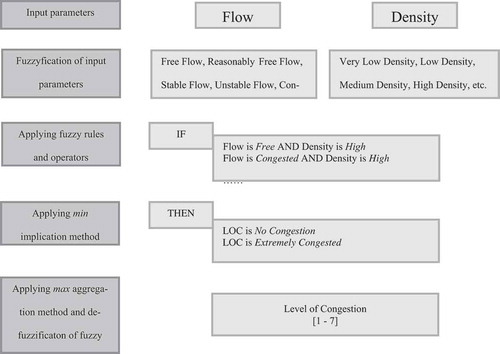
Table 4. Table view of the fuzzy inference model input variables (flow and density) and output variable (level of congestion) where levels of congestion closer to 0 indicate congestion free zones and closer to 1 severe congestion zones.
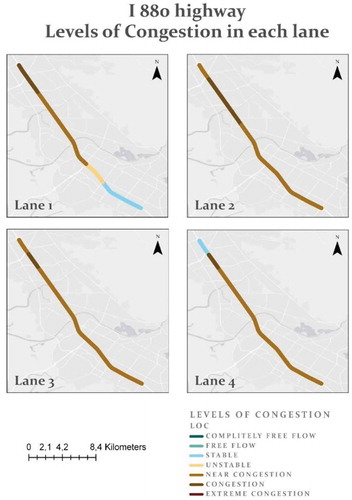
Figure 3. Levels of congestion detected between 6pm and 9pm on 8 February 2008, stretch of highway I 880 – northbound direction, in all four lanes.
Data availability statement
The data that support the findings of this study are openly available at http://traffic.berkeley.edu/project/downloads/mobilecenturydata. By downloading the data, the user acknowledges that the data would be:
Used only for research and analysis purposes.
Will not be distributed further.
Any publication using the data should refer to the following article: Herrera et al. (Citation2010) Evaluation of traffic data obtained via GPS-enabled mobile phones: The Mobile Century field experiment. Transportation Research Part C: Emerging Technologies. Pergamon, 18(4): 568–583. doi: 10.1016/J.TRC.2009.10.006.