Figures & data
Figure 1. Experimental data in the study area of northeast China at the county level in the year 2002: (a) response variable: hospital beds per 10,000 people; socioeconomic covariate variables: (b) X1 balance of urban and rural resident’s savings per capita, (c) X2 balance of loans from financial institutions per capita, (d) X3 GDP per capita, and (e) X4 primary industry output value per capita.
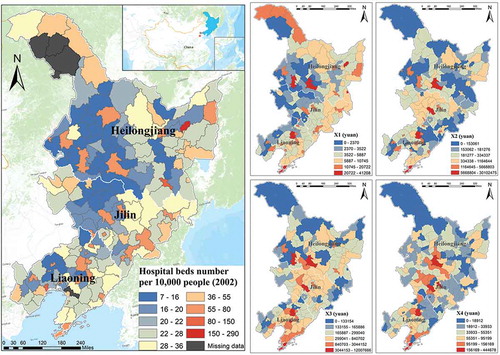
Table 1. Evaluation of five comparative Bayesian regression models accounting for model fitness, complexity, and predictive ability.
Figure 2. Time-Coefficients (TC) plots for measuring temporal healthcare-socioeconomic relationships during 2002–2011 over northeast China: X1 balance of urban and rural resident’s savings per capita, X2 balance of loans from financial institutions per capita, X3 GDP per capita, and X4 primary industry output value per capita. Dotted lines are the credible intervals representing the upper and lower uncertainties of the estimated TC.
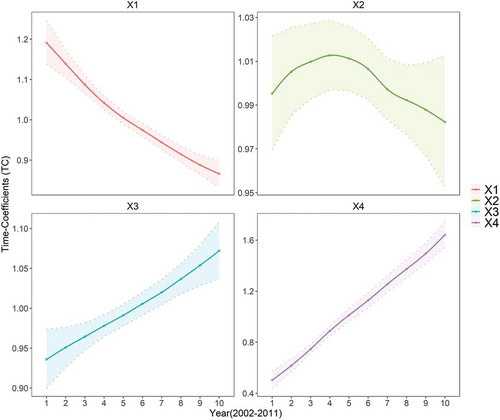
Figure 3. Space-Coefficients (SC) maps for measuring the county-level spatial healthcare-socioeconomic relationships across northeast China, and their hot spot maps: X1 balance of urban and rural resident’s savings per capita, X2 balance of loans from financial institutions per capita, X3 GDP per capita, and X4 primary industry output value per capita.
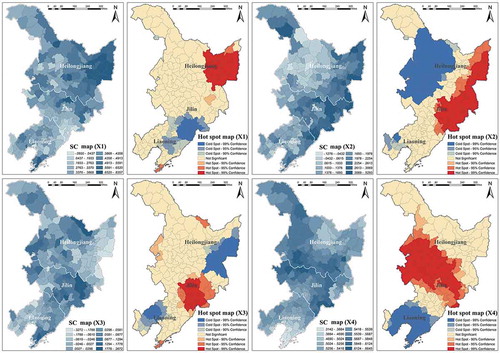
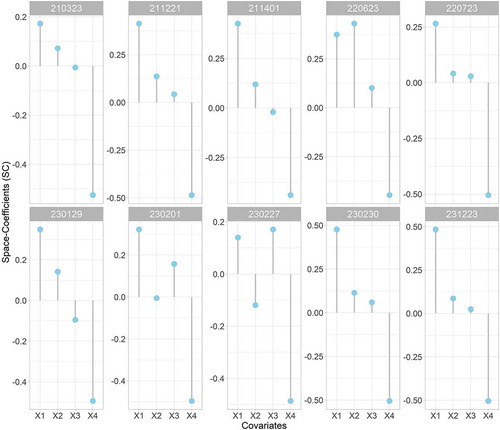
Figure 4. Lollipop charts of Space-Coefficients (SC) to display county-specific associations of healthcare resources with various socioeconomic covariates in ten counties of northeast China (210323, 211221, etc.): X1 balance of urban and rural resident’s savings per capita, X2 balance of loans from financial institutions per capita, X3 GDP per capita, and X4 primary industry output value per capita.