
Figures & data
Figure 1. The flowchart of the individual predictive flea index mapping method.
Figure 2. Location of study area: the epidemic foci of the Mongolian gerbil.
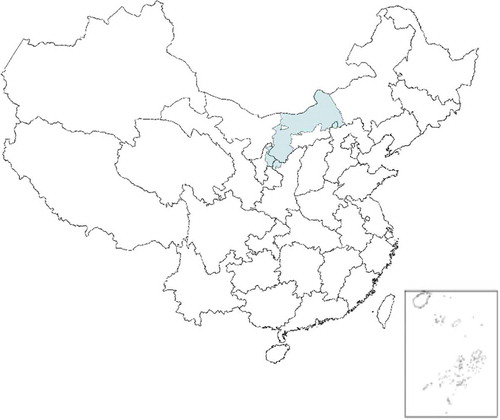
Figure 3. The location of 30 samples existing in the study area.
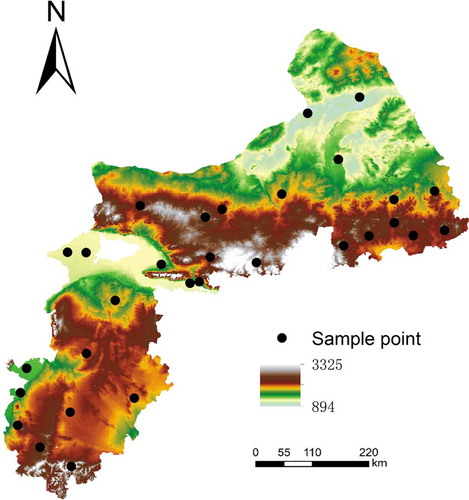
Figure 4. Five groups of training samples.
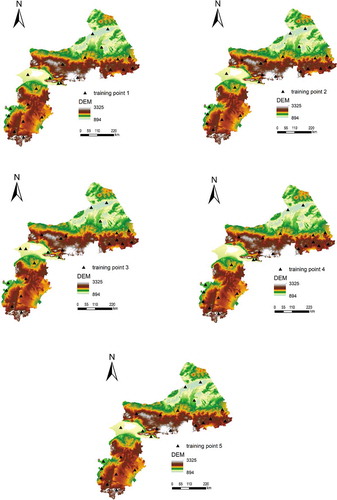
Figure 5. Spatial distribution map of flea index based on environment similarity method.
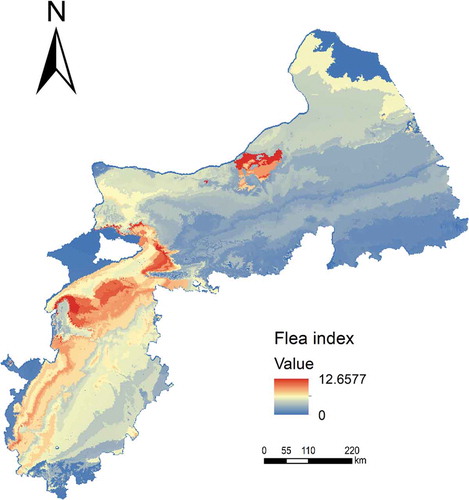
Figure 6. Spatial distribution map of flea index based on MLR.
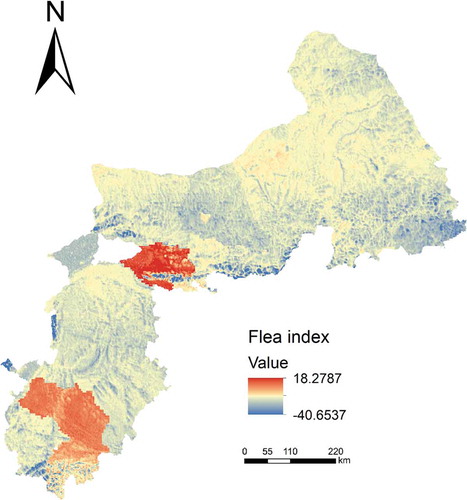
Figure 7. Uncertainty distribution map.
Table 1. Prediction accuracy of environmental similarity and MLR methods.