Figures & data
Figure 1. Flowchart for generating the contemporary Hospital Referral Regions (HRRs). LI – Localization Index.
Figure 2. Boundaries of the Dartmouth HRRs and the contemporary HRRs.
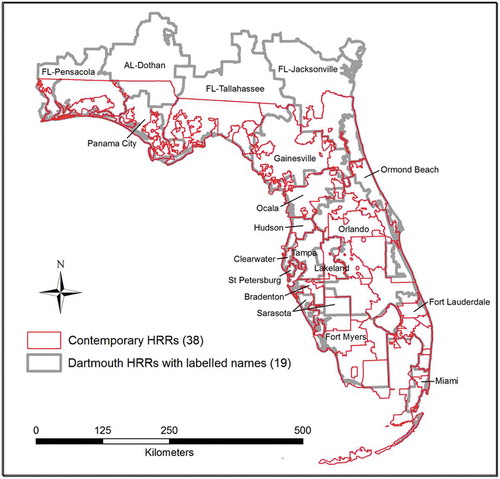
Table 1. Rates of and average hospital charges for invasive cardiovascular and neurological surgeries of the Dartmouth HRRs (Value*) and their variation within the Dartmouth HRRs (Variation**).
Figure 3. Variations in cardiovascular and neurological surgery rates across and within the Dartmouth HRRs (calculated over the contemporary HRRs): (a) cardiovascular surgery rates across the Dartmouth HRRs; (b) cardiovascular surgery rates across the contemporary HRRs; (c) neurological surgery rates across the Dartmouth HRRs; (d) neurological surgery rates across the contemporary HRRs. Red and blue circles highlight statistically significant clusters of high and low values, respectively. The contemporary HRR boundaries are removed for a clearer visualization in (b) and (d). In (b) and (d), the blank areas in the north are outside of Florida, and the blank areas in Florida (‘holes’) are uninhabitable areas (e.g. water bodies, marsh).
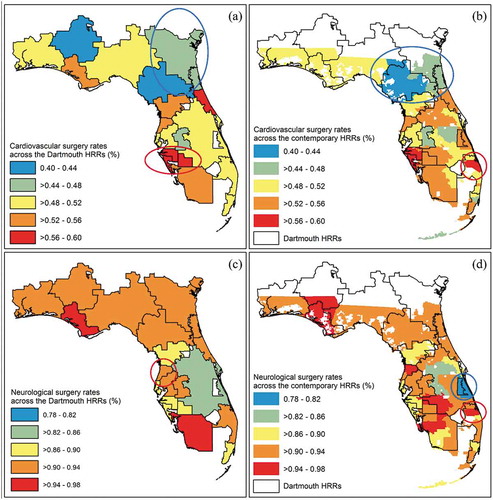
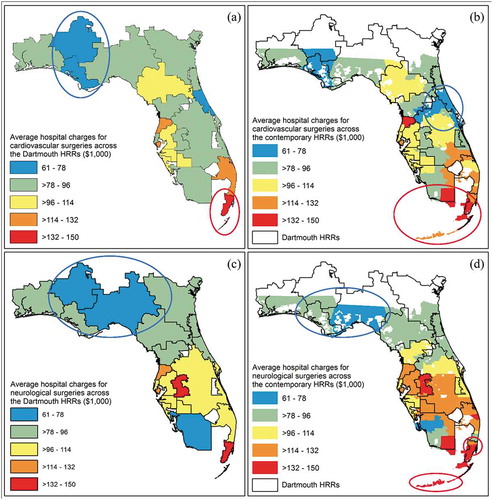
Figure 4. Variations in average hospital charges for cardiovascular and neurological surgeries across and within the Dartmouth HRRs (calculated over the contemporary HRRs): (a) average hospital charges for cardiovascular surgeries across the Dartmouth HRRs; (b) average hospital charges for cardiovascular surgeries across the contemporary HRRs; (c) average hospital charges for neurological surgeries across the Dartmouth HRRs; (d) average hospital charges for neurological surgeries across the contemporary HRRs. Red and blue circles highlight statistically significant clusters of high and low values, respectively. The contemporary HRR boundaries are removed for a clearer visualization in (b) and (d). In (b) and (d), the blank areas in the north are outside of Florida, and the blank areas in Florida (‘holes’) are uninhabitable areas (e.g. water bodies, marsh).