
Figures & data
Figure 1. Content, temporal, user, and sentiment, and spatiotemporal analysis of social media data during different event types (bold and italicized), and for different classification (or analytical) purposes (normal text) with different platform types (bold)
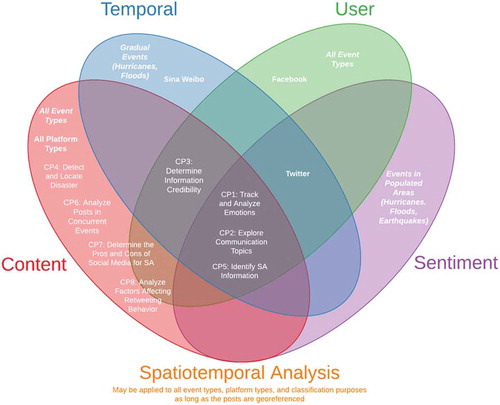
Figure 2. Classification of articles according to classification methods and year of publication of each manuscript
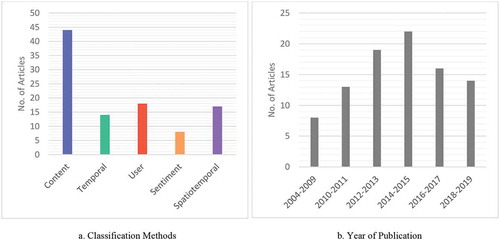
Table 1. Classification purpose (CP) abbreviation codes and their definitions
Figure 3. Percentages of different social media platforms (a) and event types (b) for message content classification. Twitter is the most prevalent platform used (63.6%) followed by various platforms (20.5%) for content classification. Other types of platforms alone are not as common, since most articles would use a variety of platforms combined together, with Twitter as an exception. The majority of articles used content classification to analyse various events rather than a single event type, since content classification can be used across all types of events
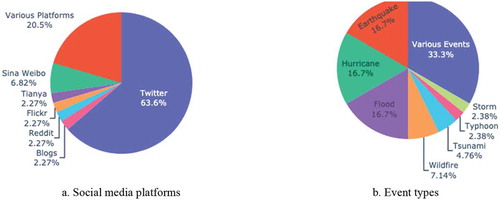
Table 2. Studies that use content classification and their purpose, event type, and platform used
Table 3. Content classification topic categories (see appendix for details)
Figure 4. Percentages of different social media platforms (a) and event types (b) for temporal classification. The percentages are mostly divided between Twitter (50%) and various platforms (35.7%). The majority of articles used temporal classification to analyse hurricanes (35.7%), since hurricanes develop gradually and information relating to SA/DM varies at different stages (pre-, during, post-event)
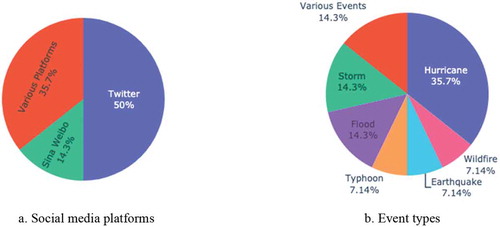
Table 4. Studies that use temporal classification and their purpose, event type, and platform used
Table 5. Temporal classification categories
Figure 5. Percentages of different social media platforms (a) and event types (b) for user classification. The most prevalent platform used is Twitter (72.2%), followed by various platforms (22.2%), and Facebook (5.56%), The majority of articles used user classification to analyse various events (27.8%), but the percentages are fairly evenly spread between each events. Like content classification, user classification can be used across all types of events
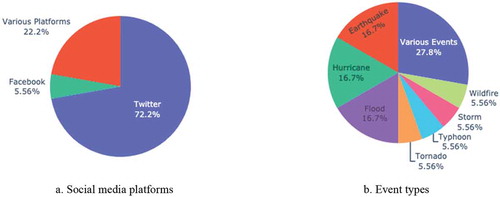
Table 6. Studies that use user classification and their purpose, event type, and platform used
Table 7. User classification categories
Figure 6. Percentages of different social media platforms for sentiment classification. The most prevalent event that articles used user classification to analyze is hurricane (50%), followed by earthquake (25%), then flood (25%)
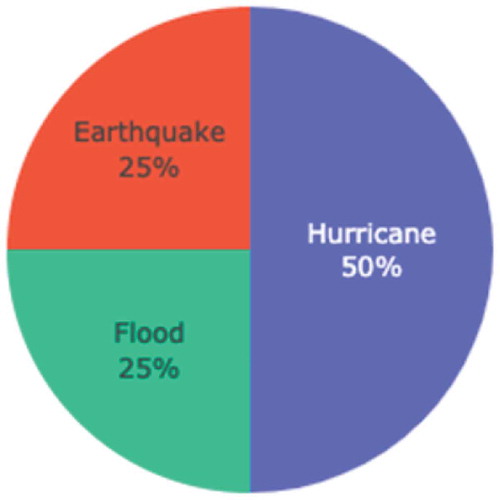
Table 8. Studies that use sentiment classification and their purpose, event type, and platform used
Table 9. Sentiment classification categories
Table 10. Studies that use spatiotemporal analysis without classification and their purpose, event type, and platform used
Figure 7. Percentages of different social media platforms (a) and event types (b) for spatiotemporal analysis. The most prevalent platform used is Twitter (76.5%), followed by various platforms (17.6%), and Flickr (5.88%), The majority of articles used user classification to analyse earthquake (35.3%), with flood (35.3%) coming in second. Hurricane, wildfire, storm, various events, and blizzard share the same percentages (5.88%)
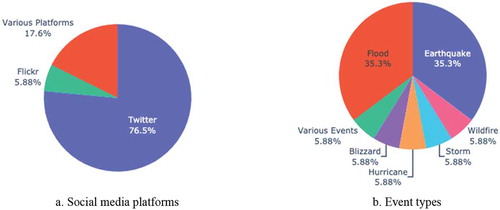
Figure 8. Event analysis based on classification method used. Excluding storm, the most prevalent classification method across all events is content classification. Spatiotemporal classification is the second most prevalent method for flood, earthquake, and wildfire. Sentiment classification is used most extensively in the event of a hurricane. User classification is ubiquitous in all events except for tsunami (not shown in figure) and storm. The figure also does not include blizzard, in which the study uses spatiotemporal analysis
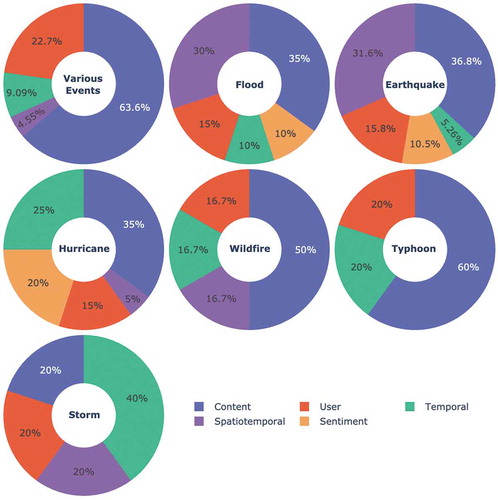
Figure 9. Event analysis based on platform used. Twitter is the most prevalent platform used across all events, including blizzard (not shown in figure due to only being represented by one study). Various platforms is tied with Twitter for wildfire, and is the second most frequently used for various events, flood, and hurricane. Flickr is used only for flood and various events, while Sina-weibo is only used for earthquake, typhoon, and tsunami (not shown in figure)
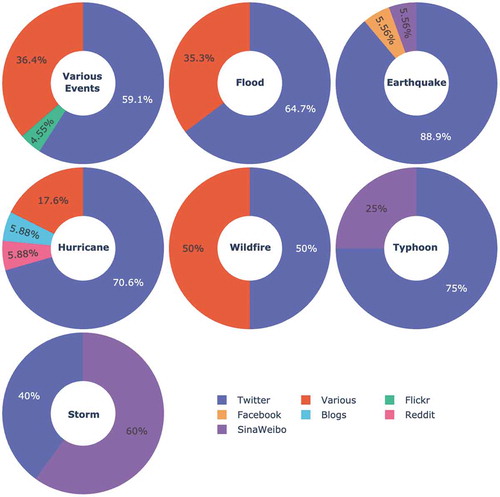
Figure 10. Classification methods and the types of events they are recommended to be used with, along with their subcategories and research agenda. Content and user classification may be used with all types of events. Temporal classification is advised to be used with events that develop over time such as hurricanes and floods. Sentiment classification would be appropriate for events that occur in a populated area, since it depends on user response and emotions. Spatiotemporal classification (not shown in figure) should be used for investigating patterns of events over time and disaster mapping
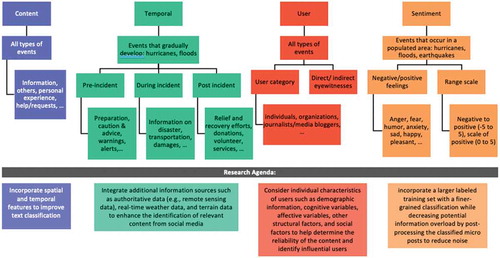
Table 3. Content classification topic categories