Figures & data
Figure 1. Study area (shown in grey) in Glasgow, Scotland.
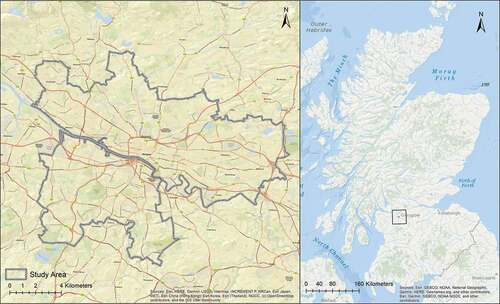
Figure 2. Data cleaning flowchart.
Table 1. Summary statistics of independent variables
Figure 3. Methodology framework.
Figure 4. Trips per month from September 2018 to August 2019.
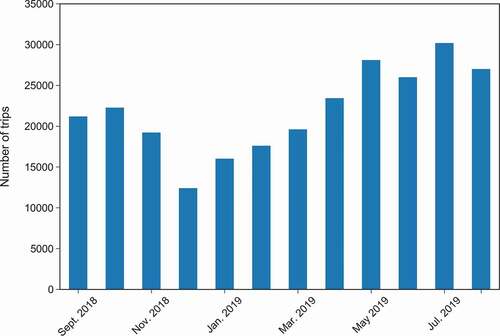
Figure 5. Number of bike-sharing trips by station.
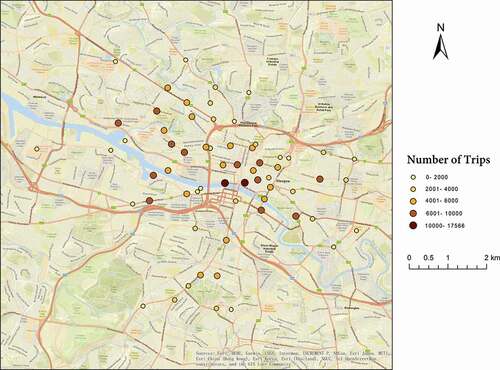
Figure 6. Quintile deprivation ranking by data zone in the Nextbike service area.
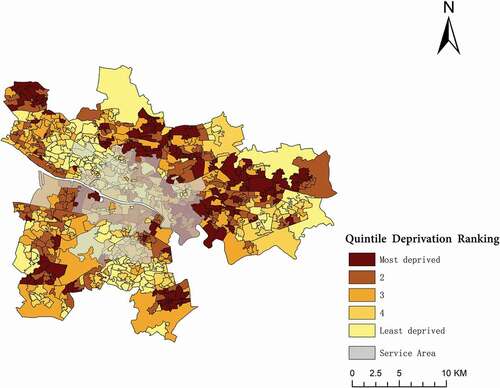
Table 2. The proportion of data zones inside the Nextbike service area by SIMD ranking
Figure 7. Two-step floating catchment area accessibility scores by data zone.
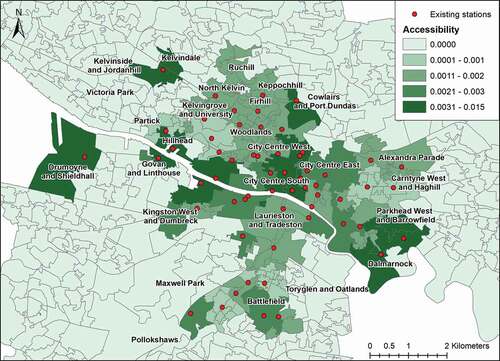
Table 3. Stepwise regression results
Figure 8. Bike-sharing demand scores for the Glasgow City Council area.
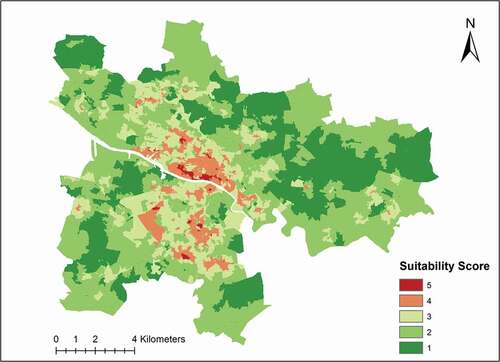
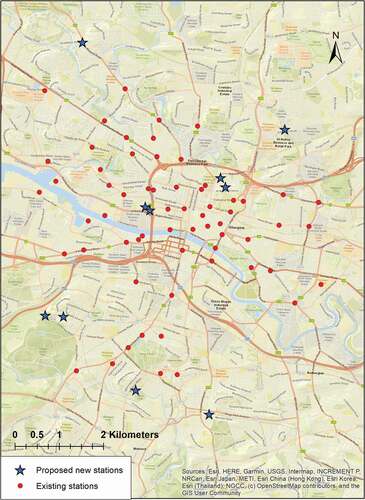
Figure 9. Five proposed new station locations.
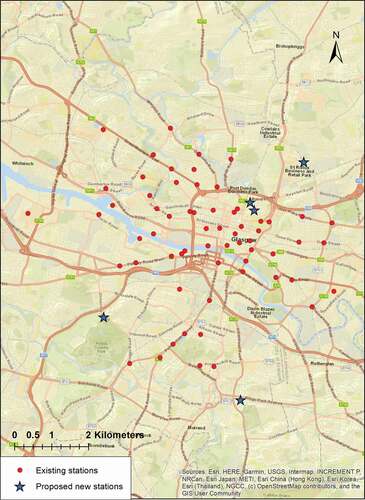
Figure 10. Ten proposed new station locations.