Figures & data
Table 1. Prediction results of the surname-based Census Model
Table 2. Sampled valid users of different groups
Figure 1. The workflow to collect, process and analyse Twitter data to explore the spatiotemporal characteristics of different economic and racial-ethnic groups.
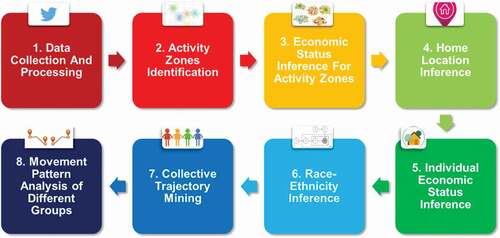
Figure 2. Tweeting density of different groups. Each group is represented by two characters with the first one indicating race-ethnicity, and the second one for economic status. Specifically, the corresponding relationships are w – Non-Hispanic White, b – Non-Hispanic Black or African American, a – Non-Hispanic Asian and Native Hawaiian and Other Pacific Islander, n – Non-Hispanic American Indian and Alaska Native, m – Non-Hispanic Two or More Races, and h – Hispanic or Latino origin respectively; r – upper-class, m – middle-class and p – lower-class. For example, wr represents the group of Non-Hispanic White and Upper-class.
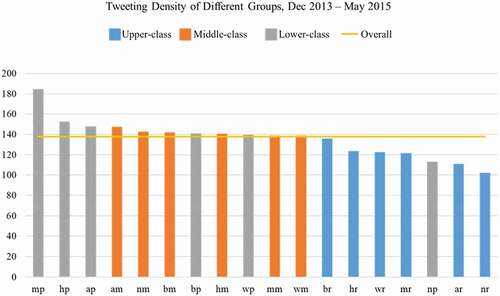
Figure 3. Power-law fit for the distributions of the number of activity zones (a) and the PDF of number of activity zones (b–k) for the residents in the U.S. top 10 populated cities with most tweets.
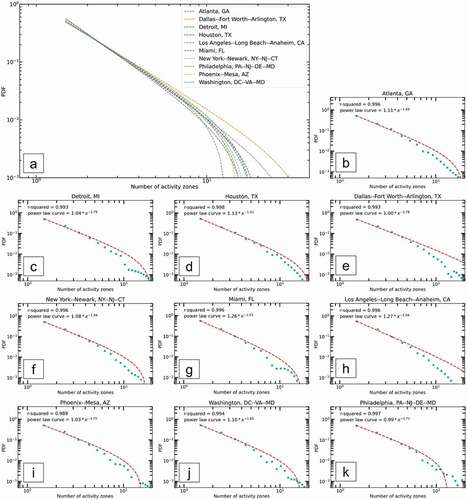
Figure 4. Average number of activity zones for different groups.
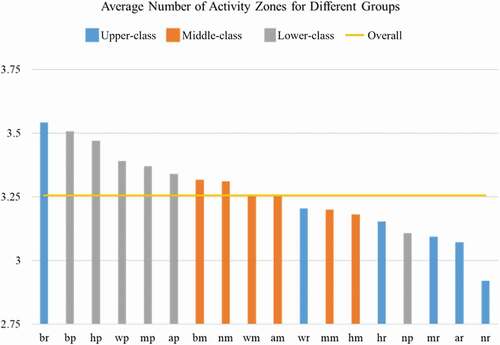
Figure 5. The PDF of activity zone numbers for different groups.
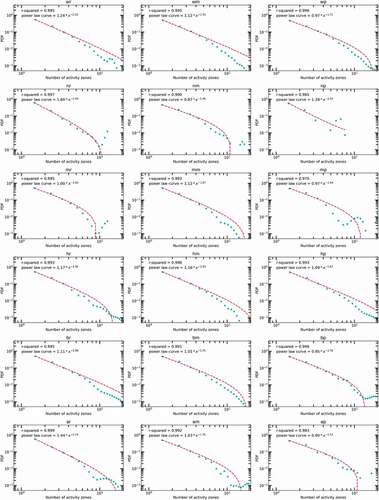
Figure 6. Power-law fit for the distributions of number of activity zones for different groups (only groups with sufficient tweets are shown).
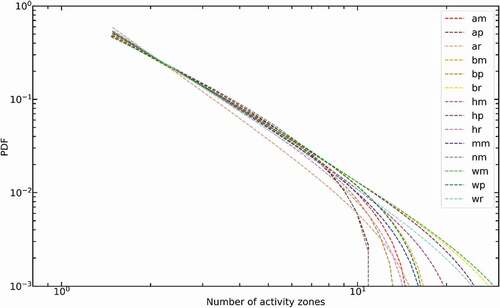
Figure 7. Twitter users’ travels from predicted homes to other activity zones among the U.S. top 50 populated cities (> 500 km travels excluded).
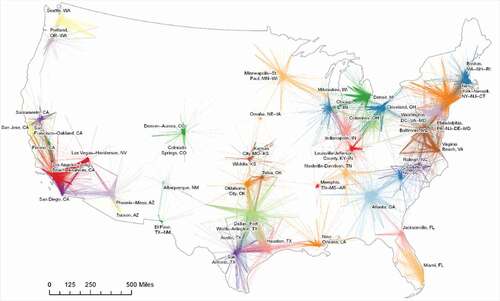
Figure 8. The travel distance distributions for individuals’ daily activity zones in the U.S. top 6 populated cities (a-f) and travel distance distributions of the U.S. top 50 populated cities (g).
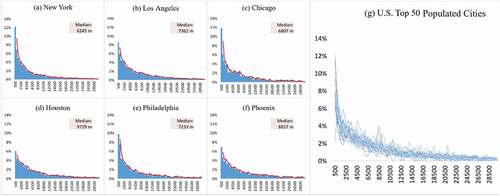
Figure 9. Power-law fit for the distributions of travel distances (a) and the PDF of travel distances (b-k) for the residents in the U.S. top 10 populated cities with most tweets.
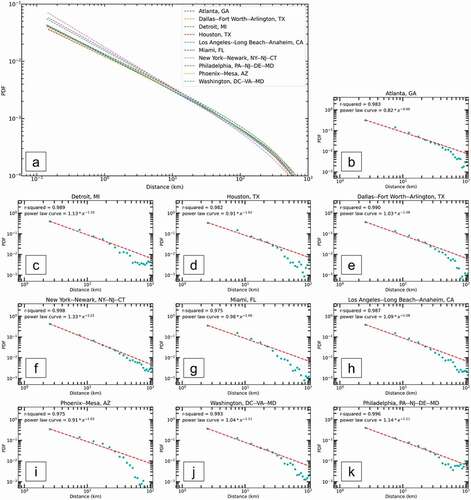
Figure 10. Median travel distances for different groups.
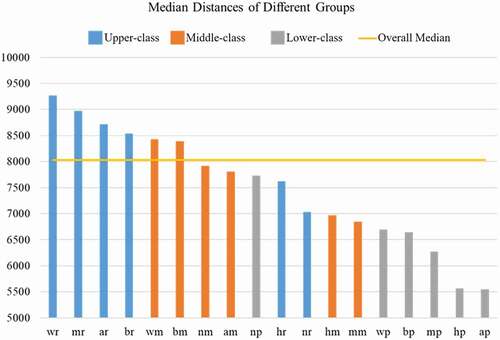
Figure 11. Travel distance distribution of different racial-ethnic and economic groups (< 30 km).
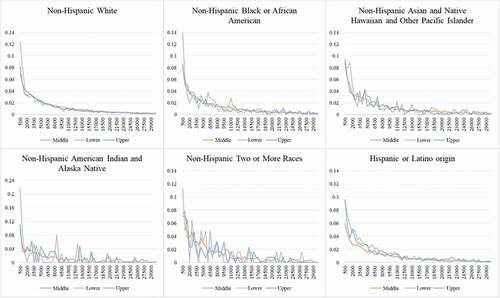
Figure 12. The PDF of travel distances for different groups.
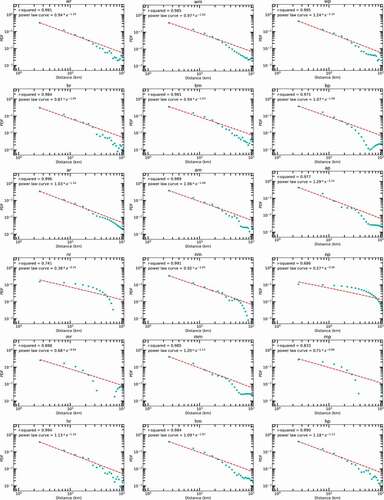
Figure 13. Power-law fit for the distributions of travel distances for different groups (only groups with 1 ≤ β are shown).
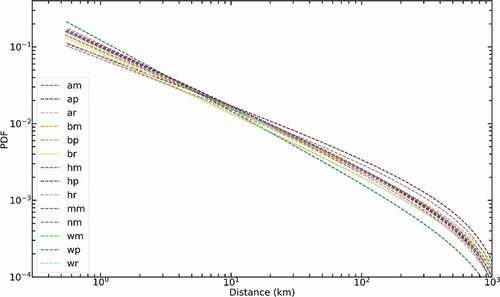
Figure 14. Percentage of outbound-city travels of the U.S. top 6 populated cities (a), and of different groups from the U.S. top 6 populated cities (b).
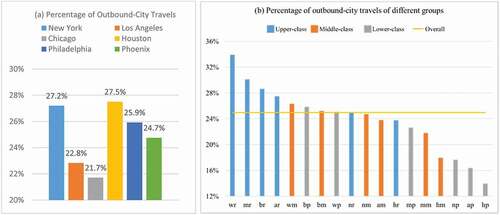
Figure 15. Percentage of different economic groups travelling to upper-class, middle-class, and lower-class communities in the U.S. top 50 populated cities (a), and percentage of different racial-ethnic and economic groups travelling to upper-class, middle-class, and lower-class communities in the U.S. top 50 populated cities (b).
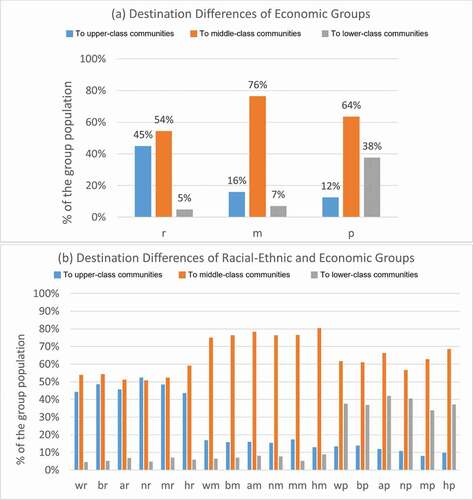
Figure 16. Percentage of different racial-ethnic and economic groups travelling to upper-class, middle-class, and lower-class communities in New York.
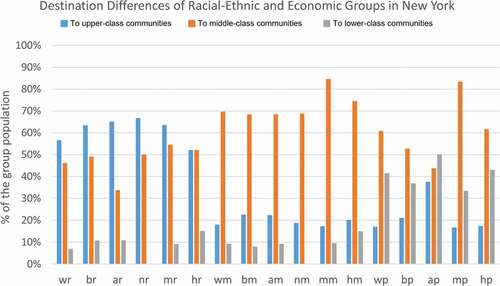
Figure 17. Inner-city travels from home to activity zones of Non-Hispanic Asian and Native Hawaiian and Other Pacific Islander + Lower-class group in New York.
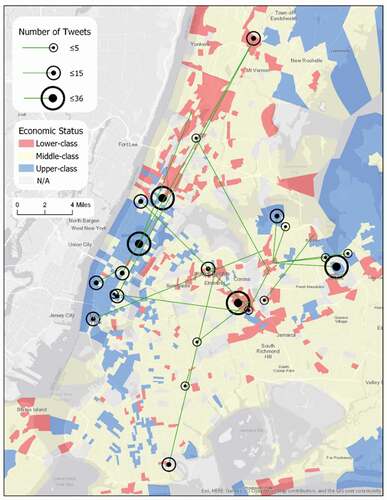
Figure 18. Percentage of different racial-ethnic and economic groups travelling to upper-class, middle-class, and lower-class communities in Los Angeles.
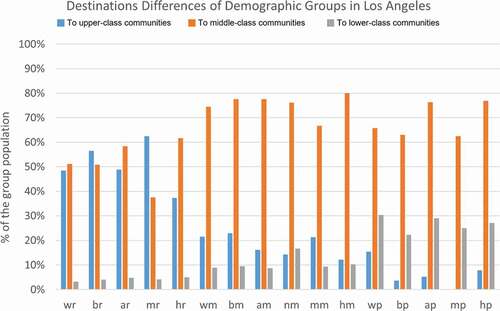
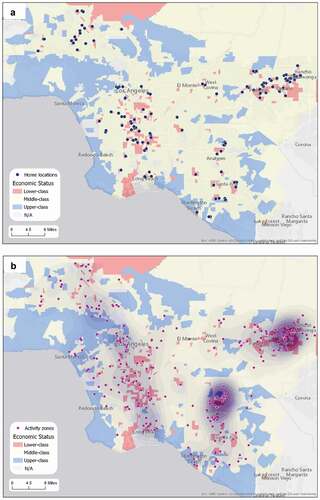
Figure 19. Movement patterns of Non-Hispanic White + Lower-class group in Los Angeles (a. Home locations; b. Activity zones).