
Figures & data
Table 1. Inclusion and exclusion criteria of article selection.
Figure 1. PRISMA flow chart on the identification and screening of studies on human mobility and COVID19 transmission.
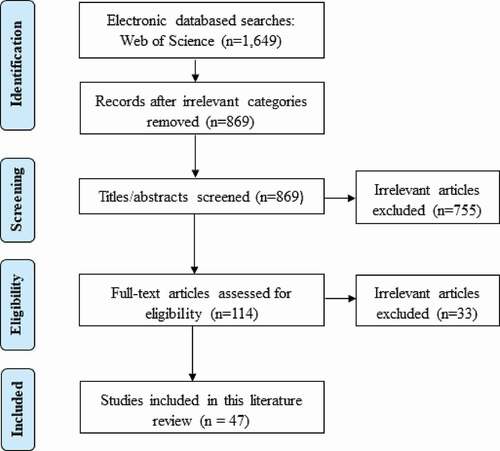
Table 2. Summary of mobility data sources used in the selected articles.
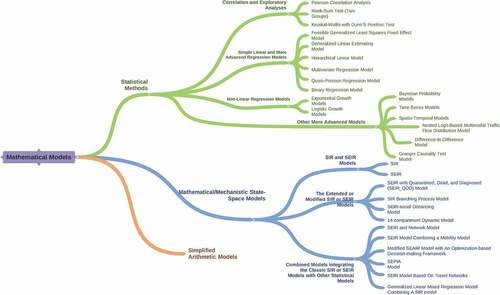
Figure 2. Summary of mathematical models applied in the selected articles.
Supplemental material