
Figures & data
Figure 1. Exposure assessment in spatial-temporal dimension (Example equations are listed to demonstrate exposure assessment approaches under different scenarios).
Figure 2. Research workflow including data collection, cleaning and analysis.
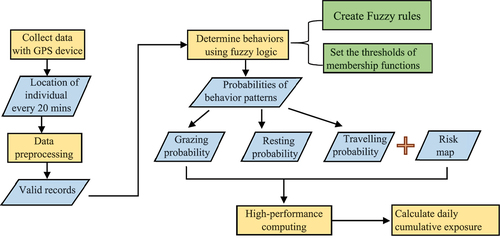
Figure 3. Distribution of AUMs in Cove.
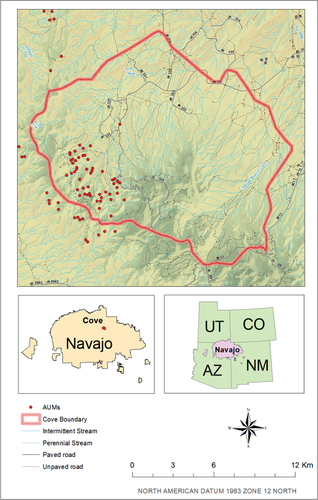
Table 1. Fuzzy rules.
Figure 4. Membership functions.
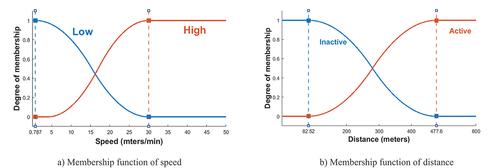
Table 2. Calculation of cumulative risk and probability.
Figure 5. Livestock location and proximity to AUMs.
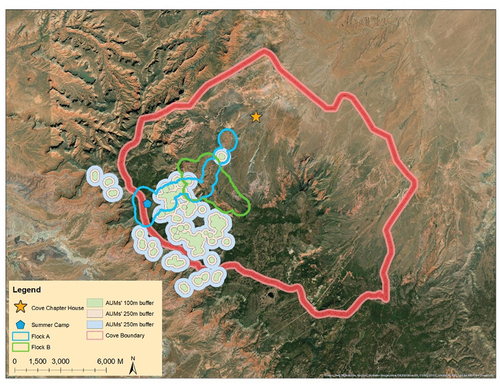
Figure 6. Daily exposure of flock A and flock B.
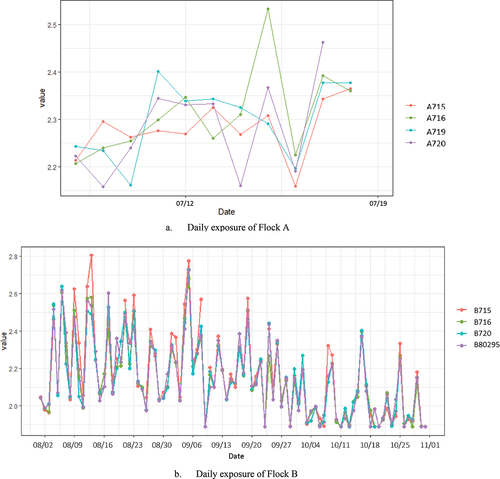
Figure 7. Geographic distribution of area associated with grazing, resting, and travelling for flock A and flock B.
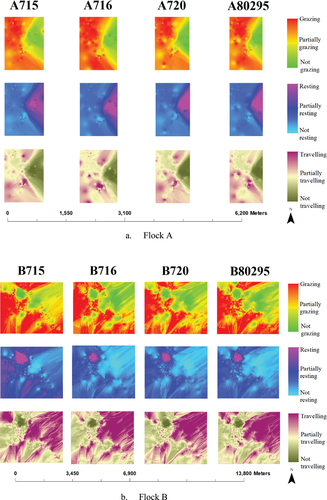
Figure 8. Daily exposure without considering behaviour patterns.
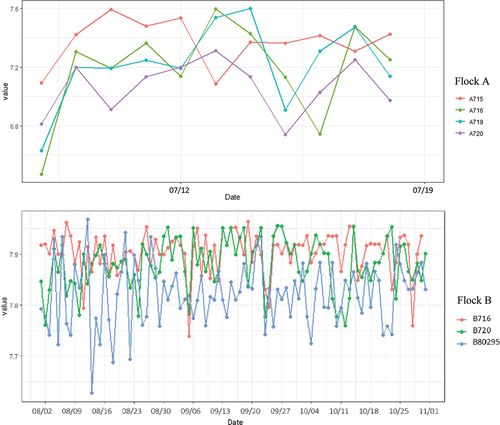
Figure 9. Daily exposure considering behaviour patterns but without probability/uncertainty.
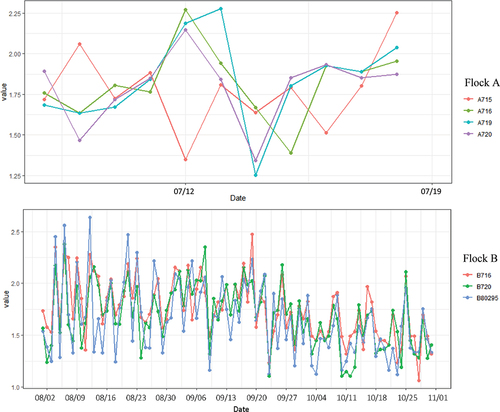
Figure 10. Points before and after the data preprocessing. (Note: Base map is excluded to protect livestock owner’s privacy).
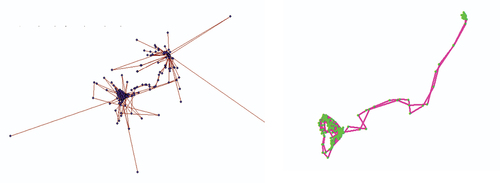
Figure 11. Histograms of livestock distance to AUMs.
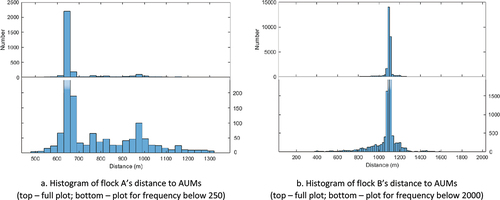
Table 3. Fuzzy membership of flock B on August 12th.
Table 4. Frequency of dominant behaviour.
Table 5. GPS data sample.
Table 6. Basic information of datasets.
Table 7. Sample result of fuzzy logic for behaviour classification.
Table 8. Frequency of resting, grazing, and travelling of flock A.
Table 9. Frequency of resting, grazing, and travelling of flock B.
Table 10. T-test of daily cumulative exposure potential of flock B comparison of the current method with those not considering probability/uncertainty.