
Figures & data
Figure 1. General overview of the RS-DeepSuperlearner method.
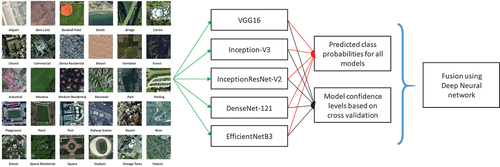
Figure 2. Diversity illustration of the CNN models used in the RS-DeepSuperlearner method.
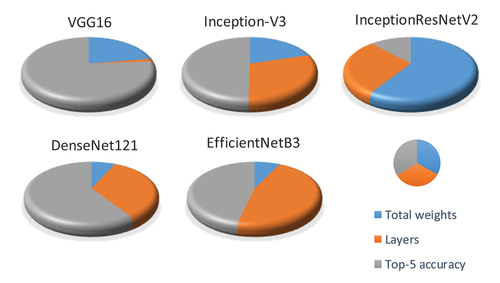
Table 1. Summary of base CNN models used in the RS-DeepSuperlearner ensemble method.
Figure 3. Modified VGG16 architecture (14,783,573 total parameters and 2,428,437 trainable parameters).
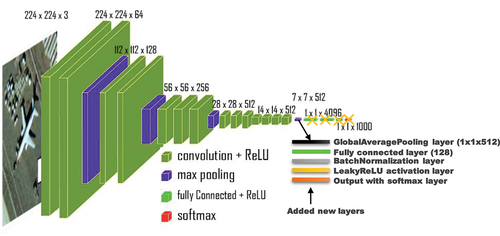
Figure 4. Modified Inception-V3 architecture (22,733,898 total params and 22,699,210 trainable).
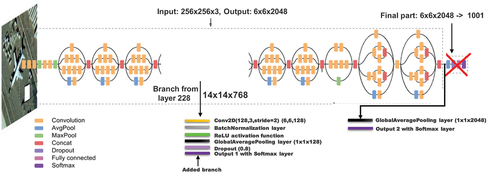
Figure 5. Modified InceptionResnet-V2 architecture (55,612,410 total params and 55,551,610 trainable).
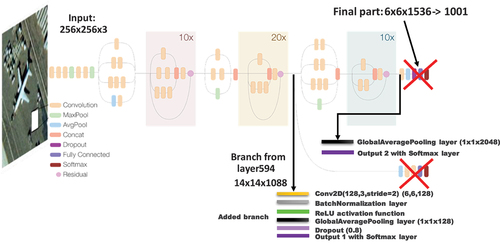
Figure 6. Modified DenseNet121 architecture used (7,652,202 total params and 7,568,298 trainable).
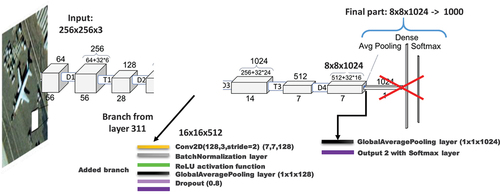
Figure 7. Modified EfficientNet-B3 architecture used (11,759,186 total params and 11,671,634 trainable).
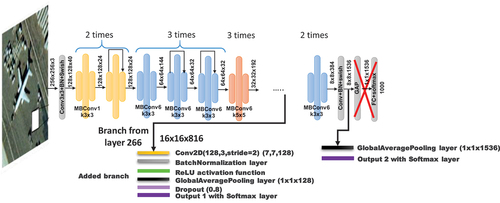
Figure 8. Architecture of the proposed DNN SuperLearner.
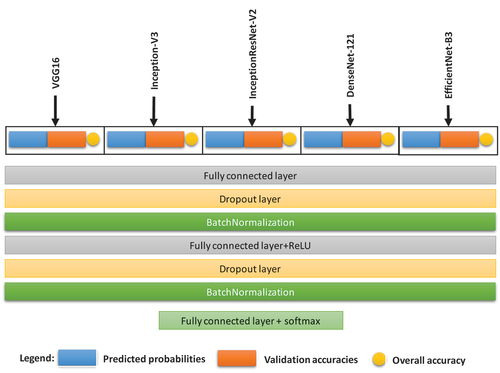
Table 2. Summary of RS datasets.
Figure 9. Training DNN metalearning model: (a) loss curve for training data; (b) OA accuracy on the test data.
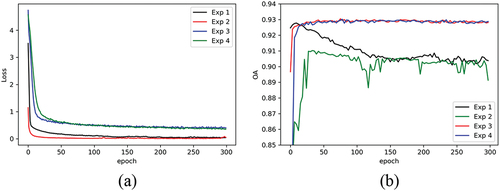
Table 3. Single-model OA for datasets and the upper bound OA when the correct model is always selected.
Table 4. Comparison results for UC Merced RS dataset.
Table 5. Comparison results for KSA RS dataset.
Table 6. Comparison results for RSSCN7 RS dataset.
Table 7. Comparison results for Optimal31 RS dataset.
Table 8. Comparison results for NWPU-RESISC45 RS dataset..
Table 9. Comparison results for AID RS dataset.
Table 10. Training execution times for the AID dataset.
Table 11. Prediction times per image for the AID dataset.