
Figures & data
Table 1. Descriptive Analysis of Covariates of EGS bypass behaviours.
Figure 1. Spatial Access Ratio (SPAR) to EGS services in California, 2014–2016 (Note: SPAR values were first calculated for CBG centroids and then interpolated to the entire state using an inverse distance weighting method; SPAR values were categorized using the Jenks natural breaks method with minor revisions, greater values of SPAR denote better spatial access).
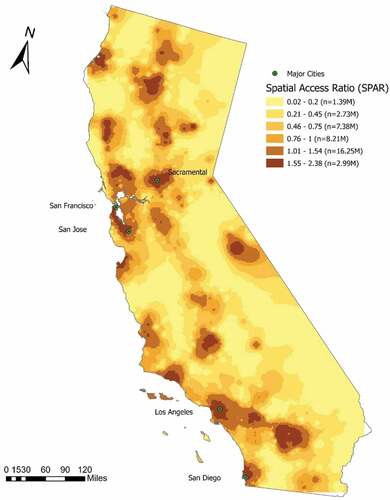
Figure 2. Exponential mean of the structured spatial component (a: the likelihood of bypass due to spatial effect by neighboring relationships; larger values mean higher likelihood of bypass) and unstructured component (b: the likelihood of bypass due to non-spatial effect; larger values means higher probability of bypass) of the BYM2 model.
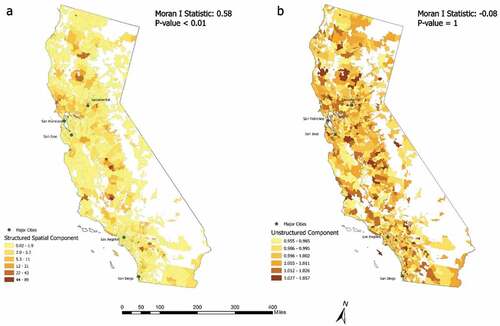
Table 2. Results of the BYM2 model.