Figures & data
Table 1. Query parameters used to retrieve tweets via twitter API.
Figure 1. Hurricane paths and the spatial distribution of hurricane-related tweets.
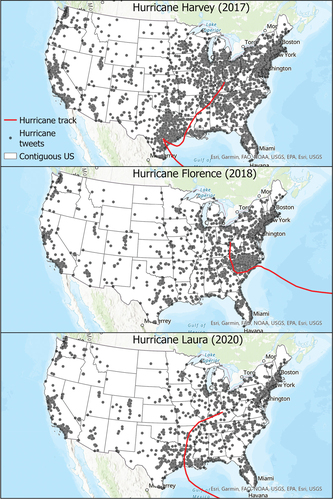
Table 2. Number of tweets for the three hurricanes after manual removal of false positives. Geotagged tweets are tweets associated with point coordinates or Twitter places (city, neighbourhood, poi).
Figure 2. Comparing ROC of Tweets over Time.
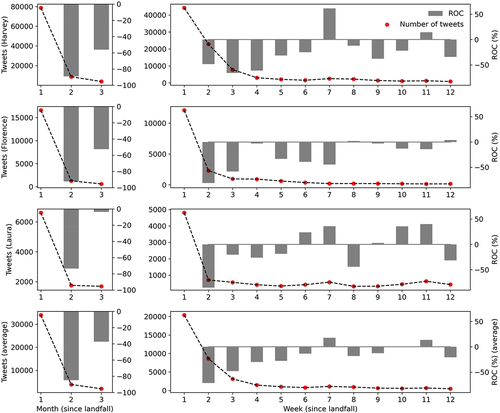
Table 3. Comparing ROC of tweets over time (monthly).
Table 4. Comparing ROC of tweets over time (weekly).
Figure 3. Word clouds of Hurricane Harvey tweets in Weeks 6 (left) and 7 (right) (the words “hurricane” and “harvey” were removed).
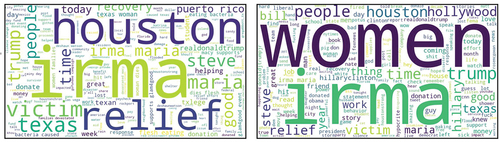
Table 5. Correlation between weekly tweet totals and time (Weeks 1–12).
Table 6. Correlation between weekly tweet totals and time (Weeks 2–12).
Figure 4. Kernel density maps of hurricane Harvey tweets over time.
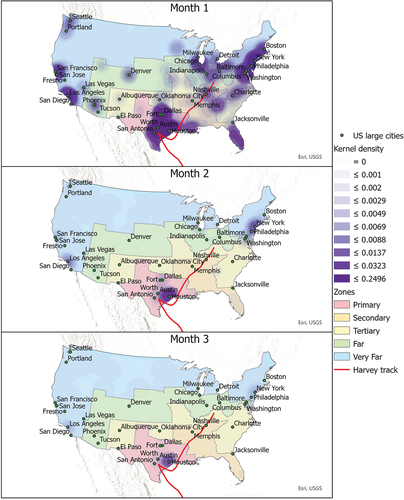
Figure 5. Kernel density maps of hurricane Florence tweets over time.
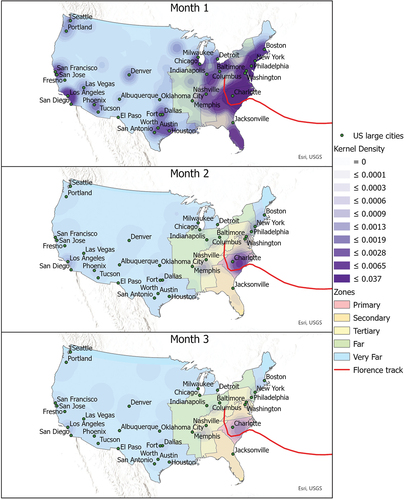
Figure 6. Kernel density maps of hurricane Laura tweets over time.
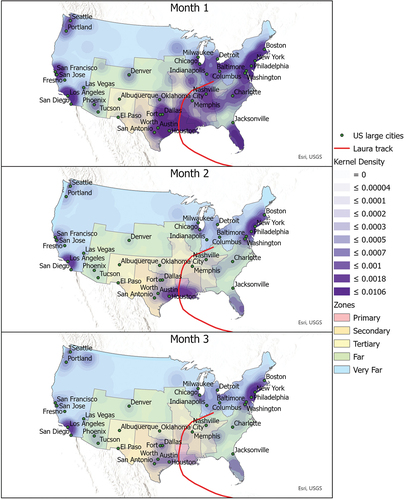
Figure 7. Tweets per 100,000 people by zone over time.
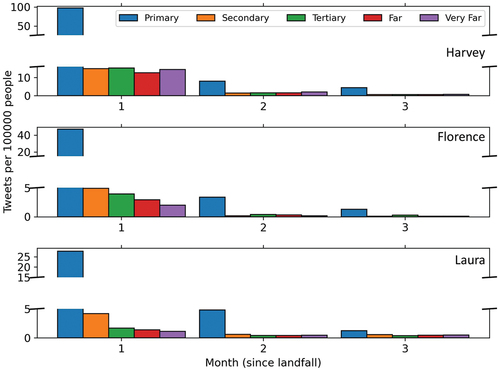
Table 7. Average ROC of tweets per 100,000 people (all hurricanes) over time by zone.
Table 8. Correlation between the number of tweets (per 100,000 people) and distance.
Table 9. Comparison of the true positive rate (TPR) and its 95% confidence interval (CI) of hurricane tweets based on random samples of tweets (n = 200) taken from the original tweets, tweets after manual cleaning, and excluded tweets on each hurricane.
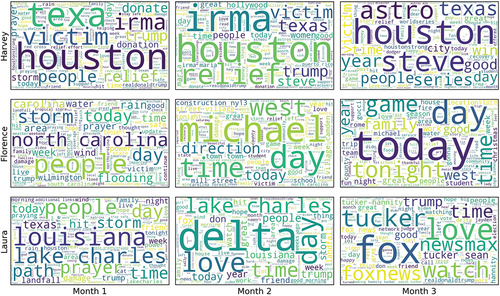
Figure 8. Word clouds of hurricane tweets (cleaned) over time. Names of the three hurricanes and the word “hurricane” were removed prior to generating the word clouds.