
Figures & data
Figure 1. A word cloud visualization based on the titles of papers published or accepted by IJGIS between January 2022 and March 2023.
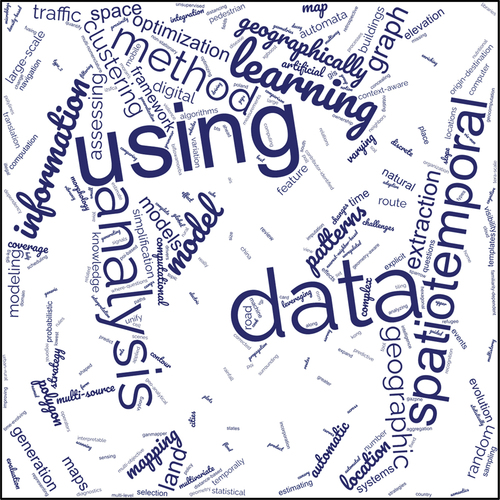
Figure 2. Advances and limitations in GeoAI research in the view of Orhun Aydin: (a) advances; (b) limitations.
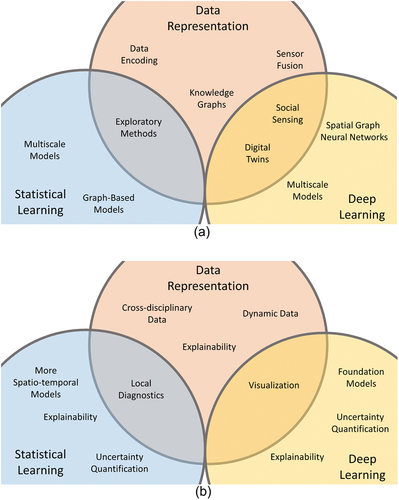
Figure 3. An example of the difficulty in interpreting the results of human settlement mapping: (a) pink and blue colors representing two different types of neighborhoods where boundaries seem to follow building morphology; (b) a confusing separation boundary output by the trained model with no apparent change in settlement structures, which makes the result challenging to explain.
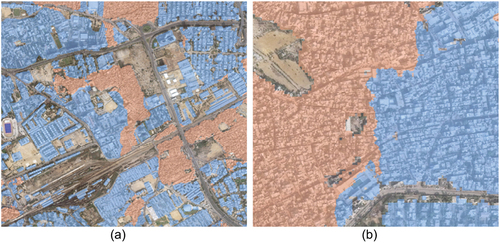
Table 1. The four questions and their answers summarized as itemized points.