Figures & data
Table 1. Numbers of unique directories and of subscribers available from the digital scans from 1881 to 1951.
Table 2. Examples of the different types of telephone directories that were made available by BT archives for this research.
Figure 1. Flowchart of the data pipeline for processing scanned telephone directory records.
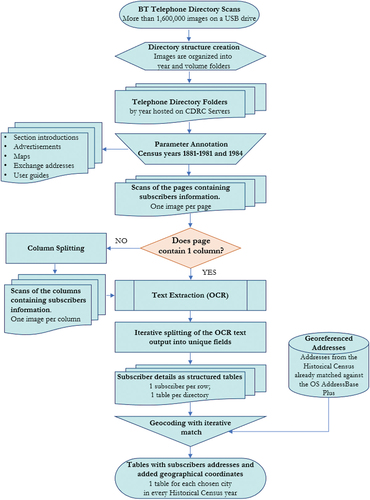
Table 3. Classification of directory pages prior to digital encoding of names and addresses.
Figure 2. Use of binarization (right) to increase contrast of a scanned image (left). Example shows a scanned archive page from 1901.
Table 4. Some functions of the ‘teldiR’ package and examples of their use cases.
Table 5. Key differences between common measures of inter-string distance implemented in R.
Table 6. Most common detected encoding errors (London directories).
Figure 3. Composite map (left) of London’s civil administrative boundaries in 1881 (right, top) and 1914 telephone exchange locations (right, bottom).
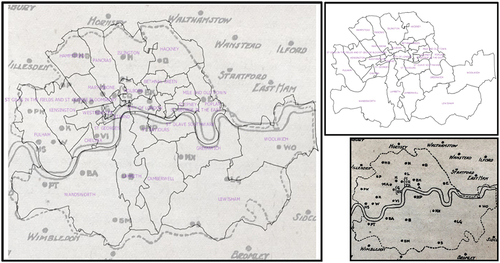
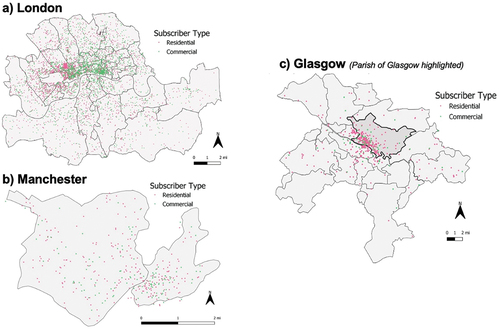
Figure 4. Locations of 1901 telephone subscribers that were geocoded in (a) London, (b) Manchester and (c) Glasgow.