Figures & data
Table 1. Active UPRNs in AddressBase Premium (epoch 96) and number of unique addresses found in the LCRs for each year, 1997–2022.
Figure 1. Flow chart depicting the process of residential housing stock imputation with digital footprint data.
Figure 2. Matching rate of unique addresses using ASSIGN, 1997–2022.
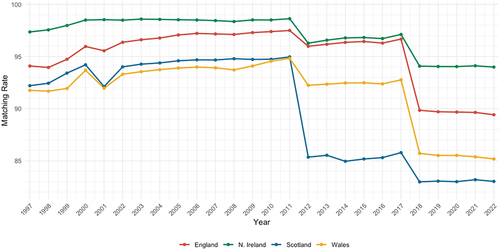
Figure 3. Housing stock estimates comparisons between ‘active’ dates derived from AddressBase Premium, official estimates made by the UK government, and our calibration using digital footprint data.
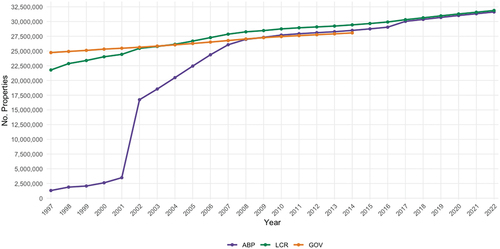
Figure 4. Google Street View imagery of “388 Banbury Road” redevelopment in (a) 2012, (b) 2014, and (c) 2015.
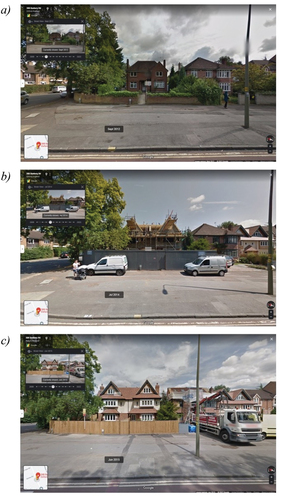
Figure 5. Estimated residential building stock by combining ABP with (a) the LCR or (b) land registry Price Paid Data. Postcode district NE10 highlighted, 1997.
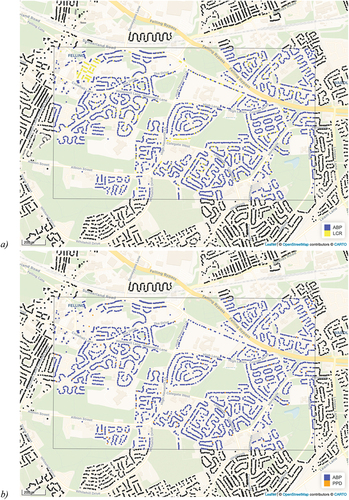
Figure 6. Estimated residential building stock by combining ABP with (a) the LCRs, (b) 2008 EPC data, and (c) 2015 EPC data. Postcode district BS21 highlighted, 2008.
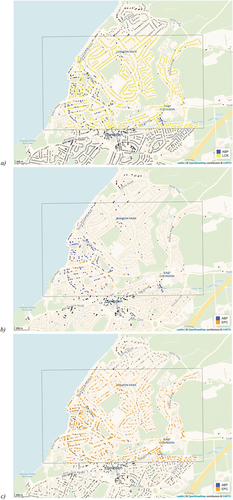
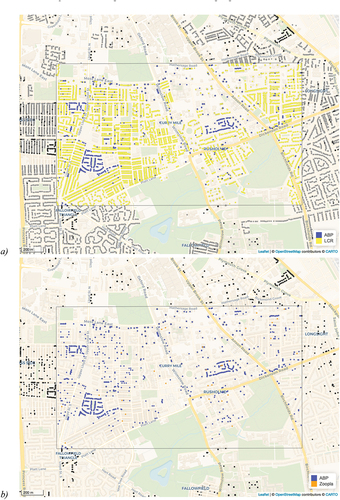
Figure 7. Estimated residential building stock by combining ABP with (a) the LCRs and (b) WhenFresh/Zoopla rental listings. Postcode district M14 highlighted, 2014.