Figures & data
Figure 1. Correlation between the colour index Iwn (443/555) and chlorophyll-a concentration in the northwestern Black Sea coastal zone (points and approximation line). R is the correlation coefficient.
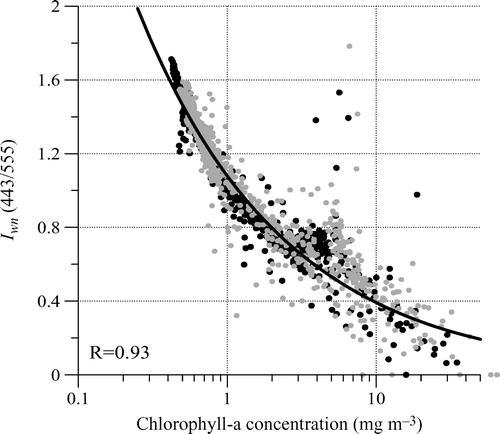
Figure 2. Correlation between NDVI W and (a) chlorophyll-a concentration, Chl = 2509.6(|NDVI W |−1/8574); (b) depth of the white disk visibility (transparency), Zd = 0.0011(|NDVI W |2.2741) and (c) concentration of suspended matter, Cv = 302198 (|NDVI W |−3.0741). Black dots represent Vegetation Health Index (VHI) based healthy vegetation on the land; red dots represent VHI-based vegetation stress; R is the correlation coefficient.
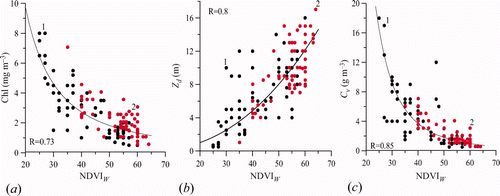
Figure 3. Advanced Very High Resolution Radiometer (AVHRR) based Vegetation Health Index (VHI) and chlorophyll-a concentration in the northwestern Black Sea for various VHI-based land conditions. In 2001 and 2003, VHI indicated stressed vegetation conditions (red/yellow colour) on the land and the average chlorophyll-a concentrations in the water were 2.51 and 1.61 mg m−3, respectively. In 1999 and 2000, VHI indicated healthy vegetation conditions (blue/green colour) on the land and the average chlorophyll-a concentrations in the water were 3.85 and 3.76 mg m−3, respectively. Available in colour online.
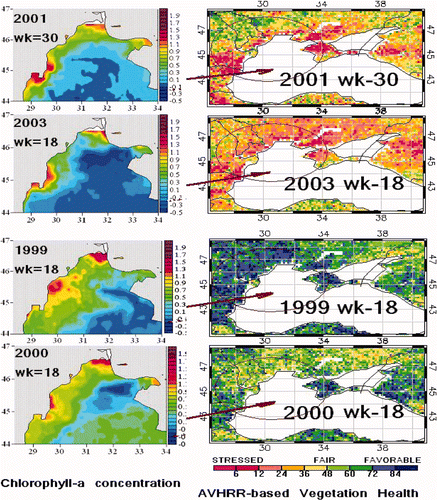
Figure 4. Relationship between average chlorophyll-a concentration in the 60–90 km marine zone of the northwestern Black Sea and land Vegetation Health Index (VHI) in the coastal zone during 1998–2008; VHI = 39.29 ln(Chl) + 12.731 is the approximation of this relationship, R is the correlation coefficient.
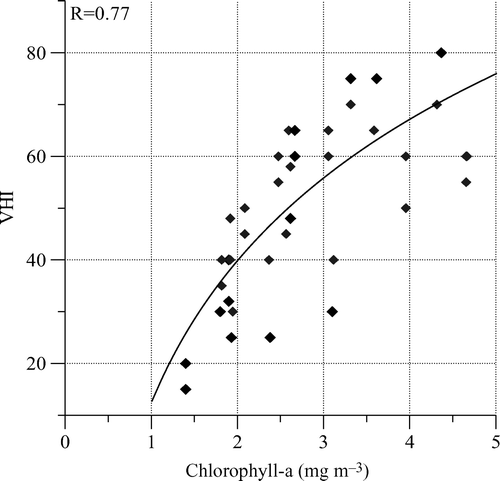
Figure 5. Annual variability of river Danube flow (QD), average chlorophyll-a concentration (Chl_1) in the entire northwestern Black Sea (44–47° N and 28.3–34° E), average chlorophyll-a concentration (Chl_2) in the 60–90 km coastal zone (44.7–46.5° N and 29.0–31.5° E) and Vegetation Health Index (VHI) for week 18 (mid-May) during 1997–2007.
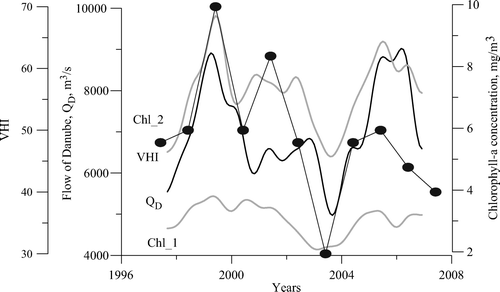
Figure 6. Normalized Difference Vegetation Index (NDVI) dynamics over land and marine ecosystems in the near-coastal zone (the coast is at l = 0); black lines represent cases with vegetation stress and grey lines represent cases with healthy vegetation on the land coastal zone.
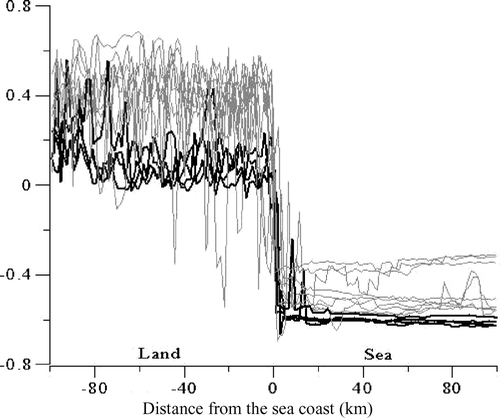
Figure 7. Relationship between NDVI W and NDVI L in the land–marine ecosystem. Black circles represent cases with stressed vegetation conditions and grey circles represent cases with healthy vegetation conditions.
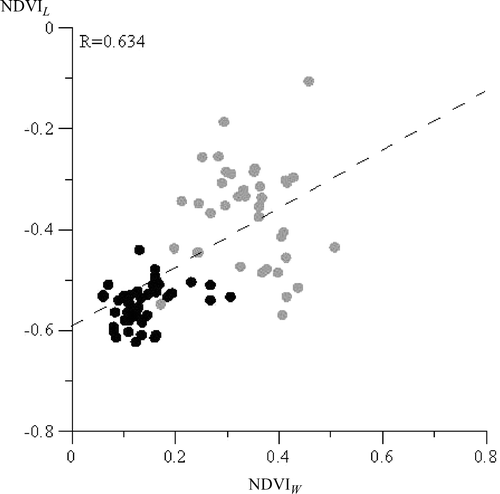
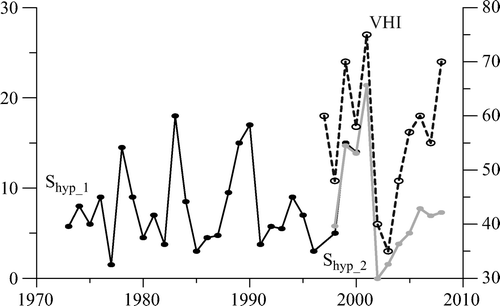
Figure 8. Hypoxia area (left scale, km2) in the northwestern Black Sea from: Shyp_1 based on Orlova et al. (2007) and Shyp_2 based on satellite data (equation (6)) and the average Vegetation Health Index (VHI) (right scale) in the southwestern Ukraine.