Figures & data
Figure 1. Location of the Varanasi observation station (marked by a green star) and the locations of the epicentres (marked by red crosses) of the nine earthquakes analysed. Available in colour online.
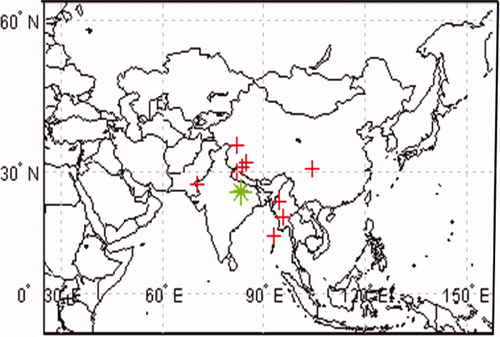
Figure 2. Schematic diagrams showing the geometry of the configuration in the conversion of slant total electron content (STEC) to vertical total electron content (VTEC) from the ionospheric pierce point (IPP) at altitude h.
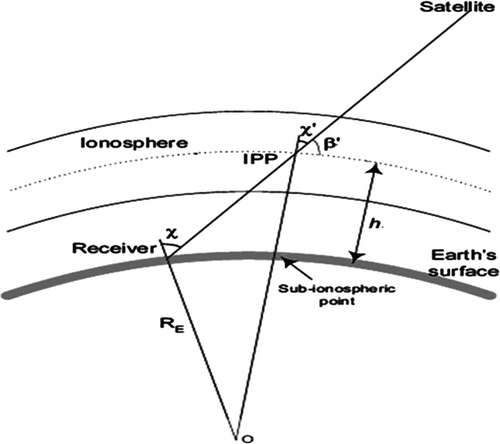
Table 1. Catalogue of the nine earthquakes analysed.
Figure 3. Variation in (a) total electron content (TEC), (b) Dst-index, (c) AE-index and (d) ap-index (15–25 March 2008) during the China earthquake (20 March 2008).
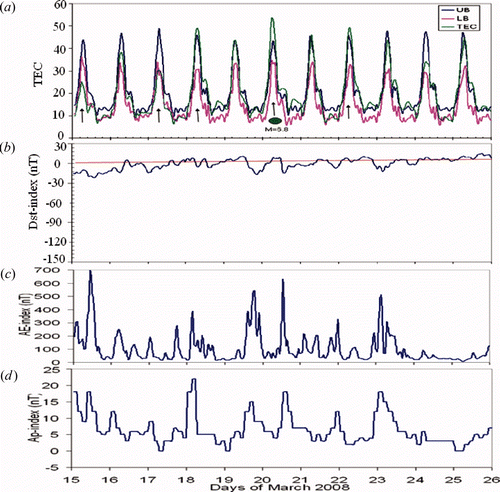
Figure 4. Variation in (a) total electron content (TEC), (b) Dst-index, (c) AE-index and (d) ap-index (3–15 April 2009) during the Jaisalmer Rajasthan earthquake (9 April 2009).
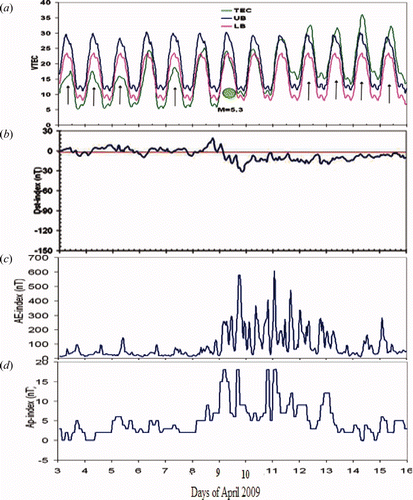
Figure 5. Variation in (a) total electron content (TEC), (b) Dst-index, (c) AE-index and (d) ap-index (24 Jul–5 August 2007) during the Myanmar earthquake (30 July 2007).
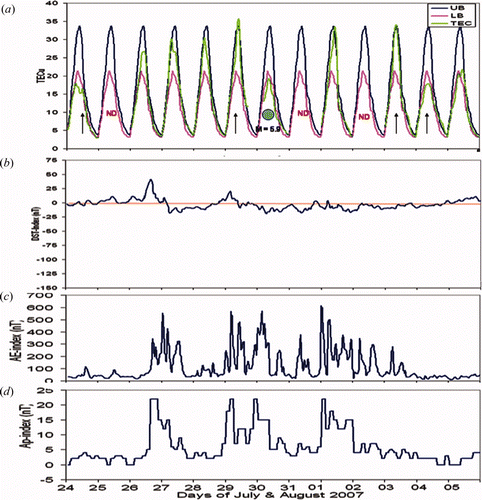
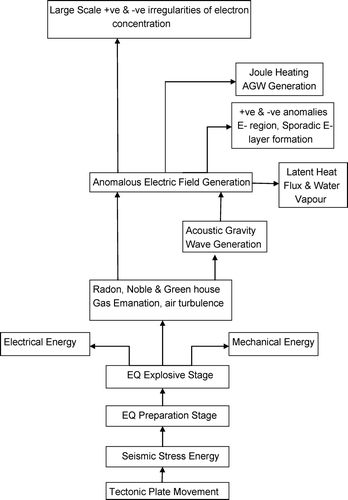
Figure 6. Block diagram showing the mechanism of seismo-ionospheric coupling.