Figures & data
Figure 1. Relationship between TECpeak and Kp during (a) a low solar activity period (2009, Rz = 2.0) and (b) a high solar activity period (1981, Rz = 143.0).1 TECU = 1016 el m−2.
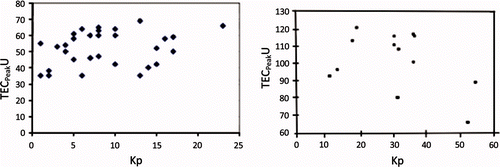
Figure 2. Day-to-day variation in TECpeak for February 2006. Here days of possible earthquakes identified by us are shown by red rectangles ![]()
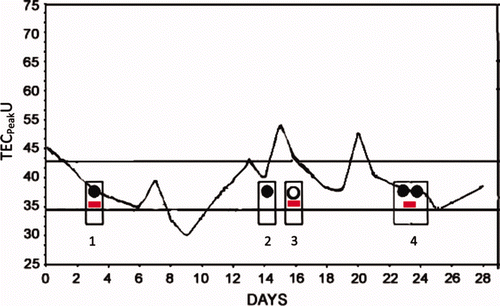
Figure 3. TEC profile shape for high solar activity period for a quiet day on 14 June 1980 and for a disturbed day on 2 February 1981. 1 TECU = 1016 el m−2.
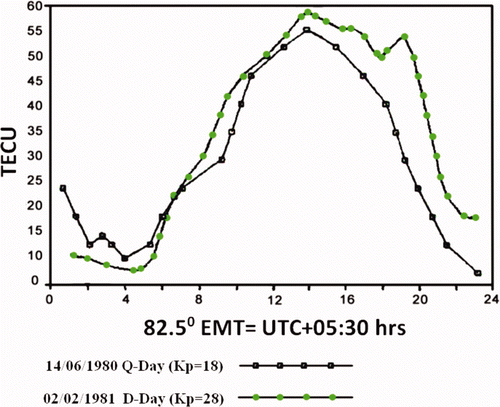
Figure 4. TEC profile shape at a low solar activity period for 24 November 2008 (red curve) with Kp = 0 and for 26 November 2008 (green curve) with Kp = 13. 1 TECU = 1016 el m−2.
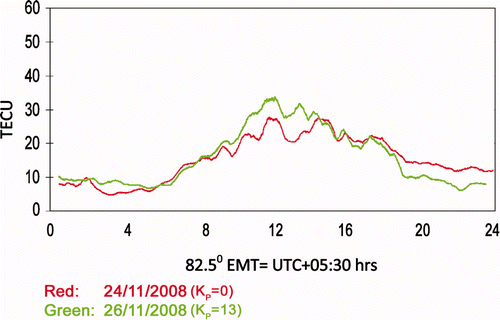
Figure 5. Superimposition of a number of TEC profiles covering pre-earthquake to earthquake days for examining modifications in TEC profile shape by the earthquake preparatory process. Earthquake event shown in the figure is for 12 August 2009. 1 TECU = 1016 el m−2.
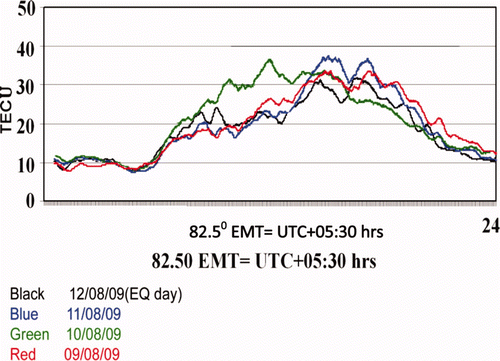
Table 1. Earthquake epicentres and magnitudes of the cases analysed with the Dynamic Time Warping (DTW) technique. The days for which total electron content (TEC) profiles are used for construction of a template are shown. Kp values for the respective day are also presented.
Figure 6. TEC profile for (a) a Q-day (representative case) and (b) a pre-earthquake day of 20 September 2009. An earthquake occurred on 21 September 2009. 1 TECU = 1016 el m−2.
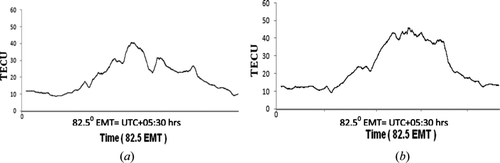
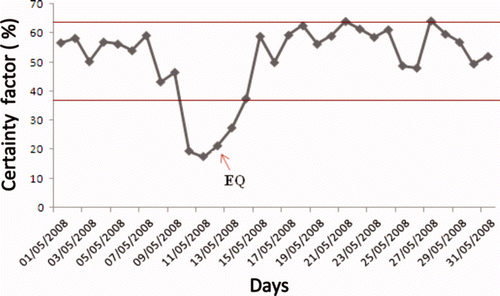
Figure 7. ‘Certainty factor’ for the month of September 2009. Note the drop in this factor during the earthquake event, which occurred on 21 September 2009.
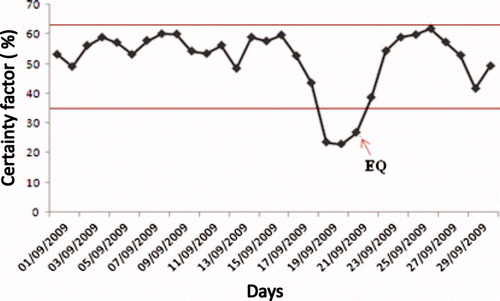
Figure 8. Identification of earthquake days by (a) TECpeak variations, (1 TECU = 1016 el m−2) and (b) DTW technique with ‘certainty factor’ for events of 2 March 2006 and 3 March 2006. The circles in the figures mark the earthquake days.
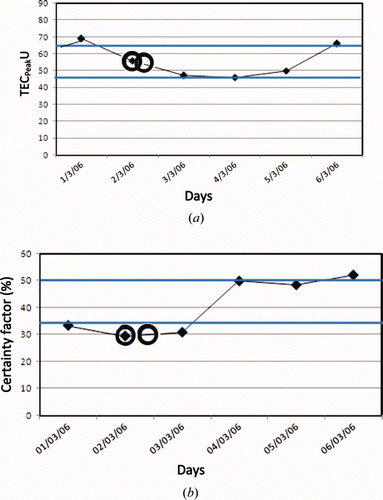
Figure 9. ‘Certainty factor’ calculated by the DTW method for May 2008. Note the dip in the ‘certainty factor’ prior to the 12 May 2008 earthquake, marked by an arrowhead. The post earthquake anomaly in the ‘certainty factor’ is likely to be associated with strong aftershocks.