1,847
Views
37
CrossRef citations to date
0
Altmetric
Articles

Person-place-time analysis of vehicle fatalities caused by flash floods in Texas

, , &
Pages 311-323 | Received 06 Jul 2011, Accepted 15 Aug 2011, Published online: 05 Jan 2012

Figures & data

Figure 1. Road inundation caused by flash floods in San Antonio. Courtesy of the City of San Antonio (used with permission). Available in colour online.
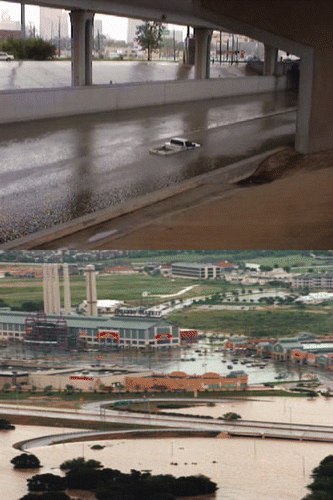
Figure 1. Road inundation caused by flash floods in San Antonio. Courtesy of the City of San Antonio (used with permission). Available in colour online.

Figure 2. The Flash Flood Alley. Obtained from the Flood Safety Education Project http://www.floodsafety.com (used with permission). Available in colour online.
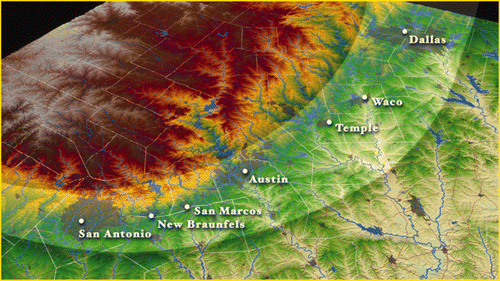
Figure 2. The Flash Flood Alley. Obtained from the Flood Safety Education Project http://www.floodsafety.com (used with permission). Available in colour online.

Table 1. The five states with the highest numbers of total flood fatalities, 1959–2009.

Table 2. Flood fatalities classified by flood type.

Table 3. Number of motor vehicle-related flood fatalities classified by age. The age is not provided in Storm Data for 149 fatalities.

Table 4. Number of flash flood fatalities classified by activity/location. The activity/location is not provided in Storm Data for 144 fatalities.

Figure 3. Motor vehicle-related flash flood fatalities in Texas from 1959 to 2009. Available in colour online.
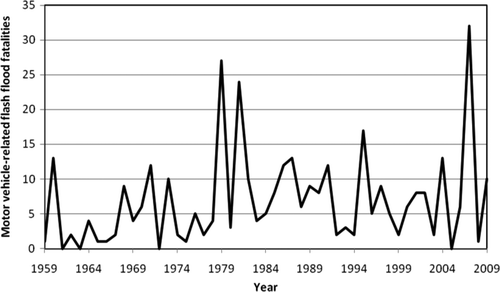
Figure 3. Motor vehicle-related flash flood fatalities in Texas from 1959 to 2009. Available in colour online.

Figure 4. Motor vehicle-related flash flood fatalities in Texas and mean precipitation in the Flash Flood Alley region by month. Available in colour online.
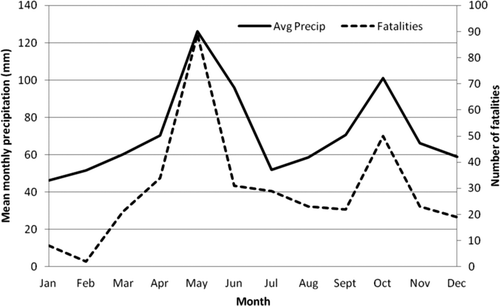
Figure 4. Motor vehicle-related flash flood fatalities in Texas and mean precipitation in the Flash Flood Alley region by month. Available in colour online.

Table 5. Texas counties with the highest numbers of vehicle fatalities caused by flash floods.

Figure 5. Map of motor vehicle-related flash flood fatalities by Texas county. Available in colour online.
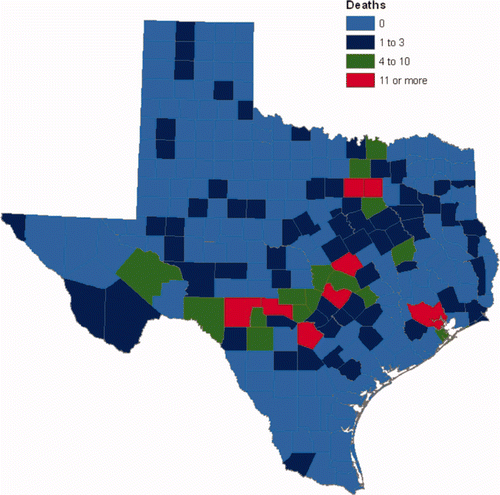
Figure 5. Map of motor vehicle-related flash flood fatalities by Texas county. Available in colour online.

Table 6. Number of motor vehicle fatalities caused by flash floods classified by time of occurrence. The time is not provided in Storm Data for 45 fatalities.

Figure 6. Map of some of the low water crossings in San Antonio. Courtesy of the City of San Antonio (used with permission). Available in colour online.
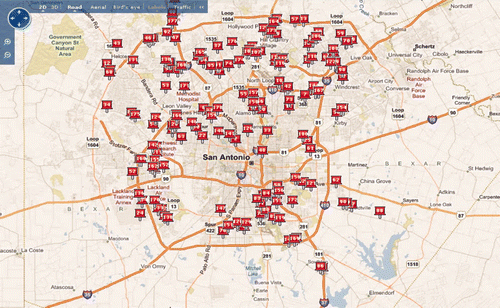
Figure 6. Map of some of the low water crossings in San Antonio. Courtesy of the City of San Antonio (used with permission). Available in colour online.

Table 7. Examples of Storm Data descriptions of the circumstances that led to vehicle fatalities caused by flash floods.

Reprints and Corporate Permissions

Please note: Selecting permissions does not provide access to the full text of the article, please see our help page How do I view content?

To request a reprint or corporate permissions for this article, please click on the relevant link below:

Academic Permissions

Please note: Selecting permissions does not provide access to the full text of the article, please see our help page How do I view content?

Obtain permissions instantly via Rightslink by clicking on the button below:

If you are unable to obtain permissions via Rightslink, please complete and submit this Permissions form. For more information, please visit our Permissions help page.