
Figures & data
Table 1. Chronological listing of earthquakes from 1500 to 1963 (area latitude 30°– 36°N and longitude 72°–78°E).
Figure 1. Tectonic setting of the Western Himalaya with special emphasis on 8 October 2005, Muzaffarabad earthquake with its CMT solution; colour-shaded areas showing IKSZ (Indus–Kohistan Seismic Zone) and estimated locations of ruptures in 1555 Kashmir (Mw 7.6) and 1905 Kangra (Mw 7.8) earthquakes (after Bilham Citation2004; Avouac et al. Citation2006). Velocity of peninsular India (given in arrow head with value) relative to stable Eurasia computed from the Euler pole of the Indian Plate determined by Bettinelli et al. Citation(2006). ISZ: Indus Suture Zone; KF: Karakoram Fault; MFT: Main Frontal Thrust; MBT: Main Boundary Thrust; MMT: Main Mantle Thrust; SRT: Salt Range Thrust; MCT: Main Central Thrust; MKT: Main Karakoram Thrust; NP: Nanga-Parbat; SS: Shyok Suture.
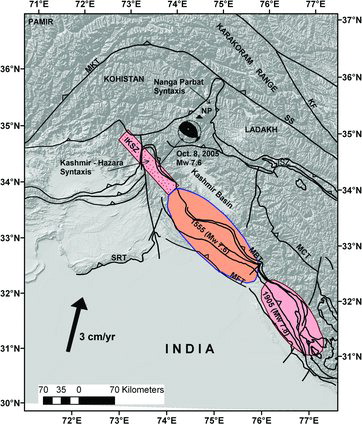
Figure 2. Seismo-tectonic map of Western Himalaya in and around the Western Syntaxis with historical earthquake data 1501–1963 (see ). The number is given as per No. of and discussed in the text. Tectonic domains, earthquake with magnitude variation and tectonic planes are shown. MBT: Main Boundary Thrust; MCT: Main Central Thrust; ISZ: Indus–Tsangpo Suture Zone; MMT: Main Mantle Thrust; SS: Shyok Suture; KF: Karakoram Fault; SF: Shinkiari Fault; AT: Attock Fault; JF: Jhelum Fault; ATF: Altyn Tagh Fault; MF: Mangla Fault; SuF: Sundernagar Fault; JT: Jwalamukhi Thrust; DT: Drang Thrust; VT: Vaikrita Thrust; KiF: Kishtwar Fault; RF: Ropar Fault; MDF: Mahendragarh Dehradun Fault; MFT: Main Frontal Thrust; KB: Kashmir basin; PB: Peshwar Basin.
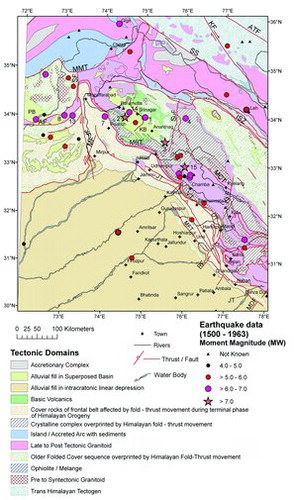
Figure 3(a). Seismo-tectonic map of Western Himalaya in and around the Western Syntaxis with earthquake data 1964–2010 and symbology as per magnitude and depth. Note five earthquake cluster zones (A–E): Kohistan arc (A); Kashmir–Hazara syntaxis (B); Nanga–Parbat (Western Syntaxis) (C); Karakoram (D) and Himachal Himalaya (E). Tectonic domains, earthquake with magnitude variation and tectonic planes are shown. MBT: Main Boundary Thrust; MCT: Main Central Thrust; ISZ: Indus–Tsangpo Suture Zone; MMT: Main Mantle Thrust; SS: Shyok Suture; KF: Karakoram Fault; SF: Shinkiari Fault; AT: Attock Fault; JF: Jhelum Fault; ATF: Altyn Tagh Fault; MF: Mangla Fault; SuF: Sundernagar Fault; JT: Jwalamukhi Thrust; DT: Drang Thrust; VT: Vaikrita Thrust; KiF: Kishtwar Fault; RF: Ropar Fault; MDF: Mahendragarh Dehradun Fault; MFT: Main Frontal Thrust.
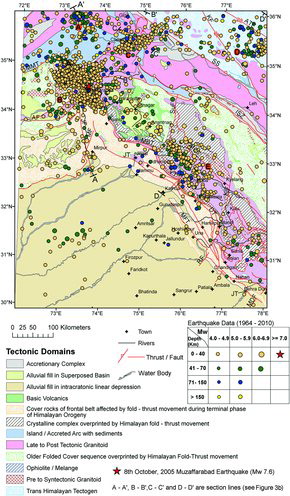
Figure 3(b). Seismo-geological sections across Western Himalaya (modified after of Mukhopadhyay et al. Citation2011b) where subducting Indian Plate and overriding Eurasian plate in the sections have resulted into generation of imbricate structure. Position of section lines is marked in . Note the low dipping Indian Plate in Kashmir-Hazara and Kohistan arc sector in section A–A′. Thickening of Indian Plate in sections B–B′ and C–C′ along Naga Parbat is noteworthy. The imbrications are again relevant in Himachal Himalaya–Karakoram sector along section D–D′. The important beach ball diagrams are placed in the section to understand the tectonic variations across arc. For reference of CMT solution, please refer to with number given in the sections. NP – Nanga-Parbat.
Figure 3(c). Isoseismal map of 8 October 2005 Muzaffarabad earthquake, Mw 7.6 (after Pande et al. Citation2006). Green line indicates surface rupture.
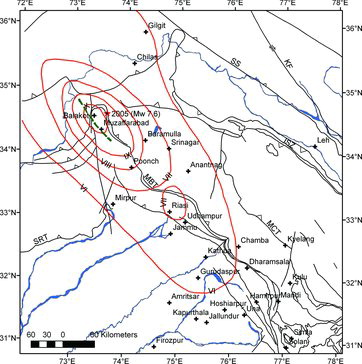
Figure 4. Frequency–magnitude distribution of the data (1964–2010) in the catalogue used. The result of the MAXC approach (Wiemer and Wyss Citation2000) is indicated with the arrow as magnitude completeness (Mc = 4.0).
Table 2. CMT solutions (source: http://www.seismology.harvard.edu) for 70 earthquakes (period 1980–2009) in the Western Himalaya. The solution parameters are discussed in the text. The value of first column (No.) is plotted on the maps () and beach ball diagrams ().
Figure 5. (a) DEM with Tectonic planes and locations of CMT solutions (70 numbers of ). No. of is placed as number. The blow-up version with locations of CMT data (b) Kashmir–Hazara Systaxis with mainly aftershocks of 2005 Muzaffarabad earthquake and (c) part of Nanga-Parbat Syntaxis.
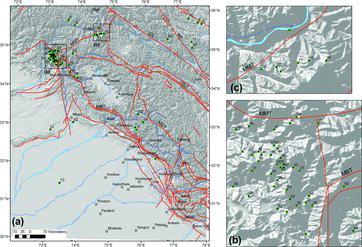
Figure 6. Beach ball diagrams of 70 numbers of fault plane solutions listed in and located on the map with numbers ().
Figure 7. Maps showing spatial variation in b-value from time domain 1969 to 2010; b-value map of (a) January 1981 (earthquake database January 1969–December 1980), yellow box indicates the epicentral block of Muzaffarabad earthquake, (b) January 1993 (earthquake database January 1981–December 1992), (c) January 2005 (earthquake database January 1993–December 2004), (d) January 2011 (earthquake database January 2005–December 2010), b-value is calculated for 1° × 1° blocks plotted at the centre of each block and contoured. Epicentre for the 8 October 2005 Muzaffarabad earthquake (star) and 1905 Kangra earthquake as filled circle are shown. Note that the epicentre of 2005 locates close to the moderate high b-value zone.
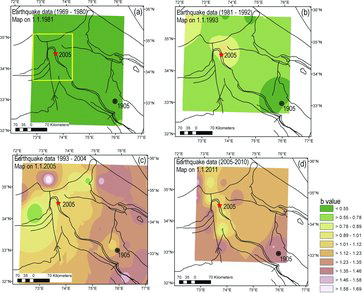
Figure 8. Temporal variation in b-value in the epicentral block (marked as box in ) of 8 October 2005 Muzaffarabad earthquake. See the standard error in b-value estimation in different bins as table. Note the high–low b-value couplet preceding the 2005 Muzaffarabad earthquake.
Table 3. Expected return period with expected maximum magnitude (Mw) as per Gumbel's extreme value statistics.
Figure 9. Type III Gumbel probability plot between the R, reduce variate [−ln(−ln Pj)] and Mwmax with the model for the period 1820–2010. The expected extreme magnitude for chosen return period is tabulated ().
![Figure 9. Type III Gumbel probability plot between the R, reduce variate [−ln(−ln Pj)] and Mwmax with the model for the period 1820–2010. The expected extreme magnitude for chosen return period is tabulated (table 3).](/cms/asset/2306212d-bc41-4b2e-9934-a46927d658af/tgnh_a_832405_f0009_b.gif)