
Figures & data
Figure 1. Neotectonics map of Turkey and the study area (compiled from, Dewey et al. 1986; McClusky et al. Citation2000; ten Veen et al. Citation2009, and Hall et al. Citation2009). MG: Menderes graben system, CA: Cyprus arc, NAF: North Anatolia fault, EAF: East Anatolian fault, RB: Rhodes basin, PST: Pliny–Strabo trench, IA: Isparta Angle, FBFZ: Fethiye–Burdur fault zone, AKSFZ: Aksehir Simav fault zone.
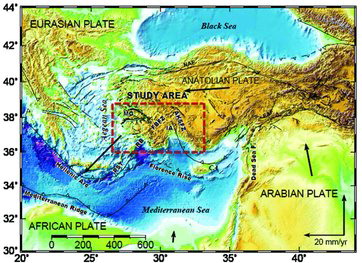
Figure 2. Southwest Anatolia GNSS network (• permanent station, ▴ periodic station).
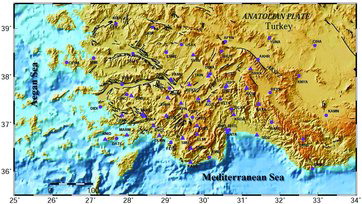
Figure 3. Time series of KAMN and CESM stations.
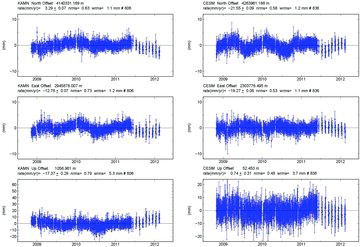
Figure 4. NRMS values obtained from daily repeatability.
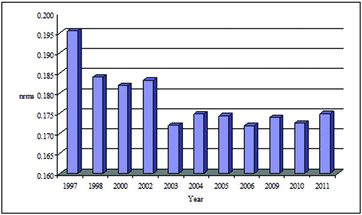
Table 1. The IGS stations used in the stabilization.
Figure 5. Horizontal velocities with respect to Eurasia Fixed Reference Frame.
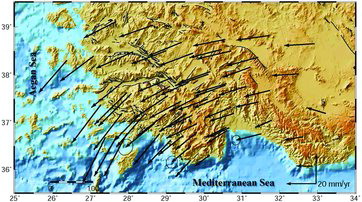
Figure 6. Significant strain rates.
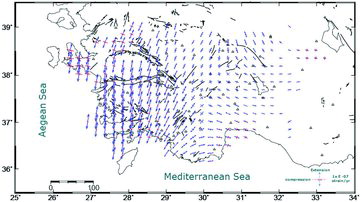
Figure 7. The location of earthquakes with a magnitude greater than 3.5 in southwest Anatolia between 1900 and 2012.
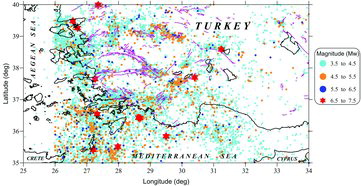
Figure 8. b value map including earthquakes that occurred at all levels of depth. The average b value is indicated with the red line.
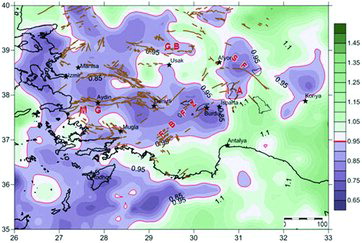
Figure 9. b value map including earthquakes that occurred at depths from 0 to 15 km. The average b value is indicated with the red line.
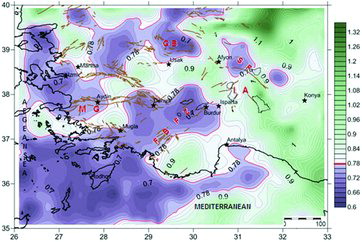
Figure 10. Occurrence likelihood (%) of a magnitude 6 and/or higher earthquake in the next 25 years.
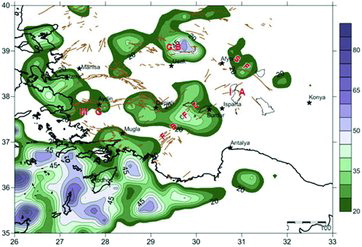
Figure 11. Relation of the calculated strain rates with the b parameters.
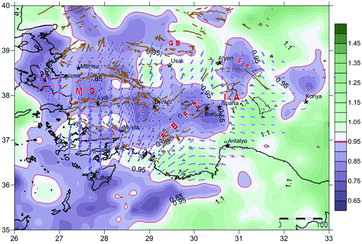
Table 2. Relation between strain rates, b parameter and earthquake occurrence likelihood.